The processing statistics for the EB-5 program have changed dramatically over the past 11 years. The program has grown significantly, with thousands more investors in 2019 than in 2008, but trends are showing a decline from the peak in 2017. The drop could be partially attributed to the backlogs at United States Citizenship and Immigration Services (USCIS), which have also been increasing. The below graphs present a comprehensive overview of the processing statistics in the EB-5 program from 2008 to 2019.
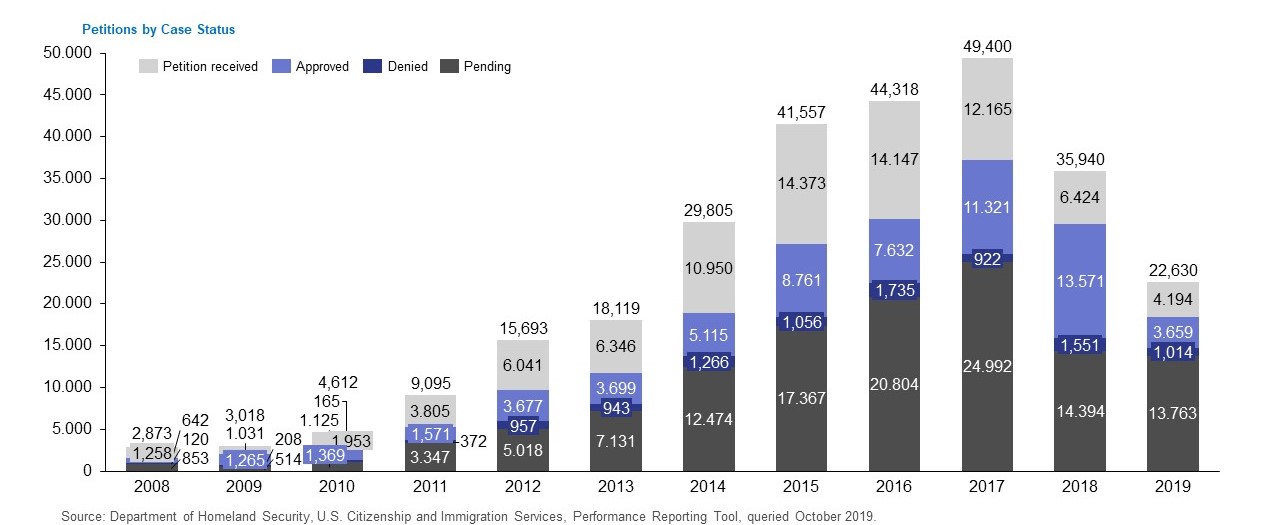
I-526 Petitions Peak in 2017, Drop Dramatically

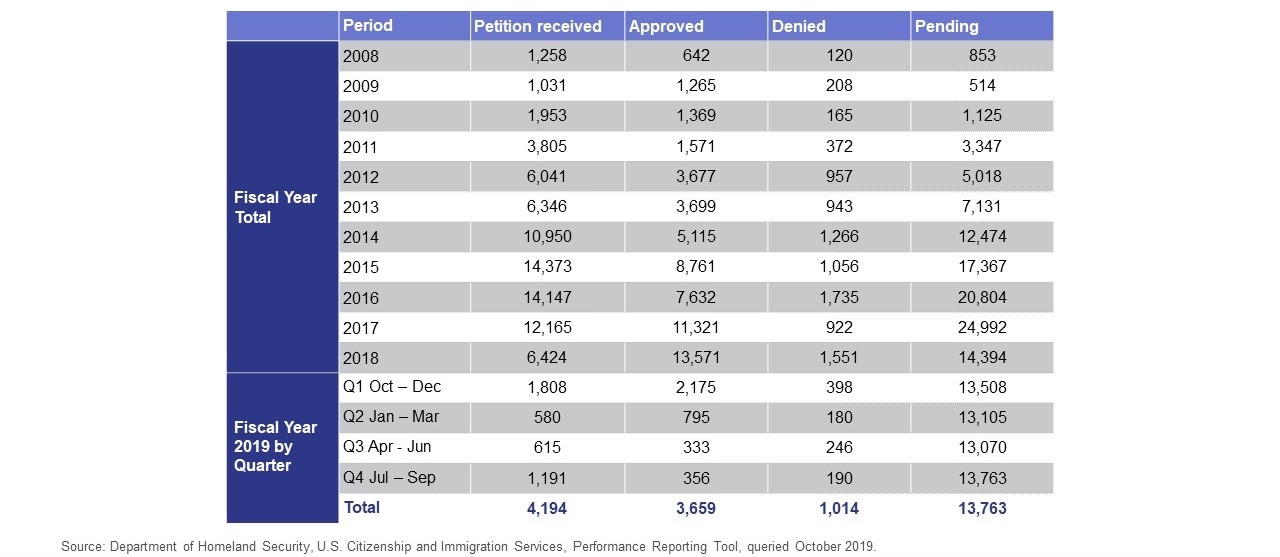
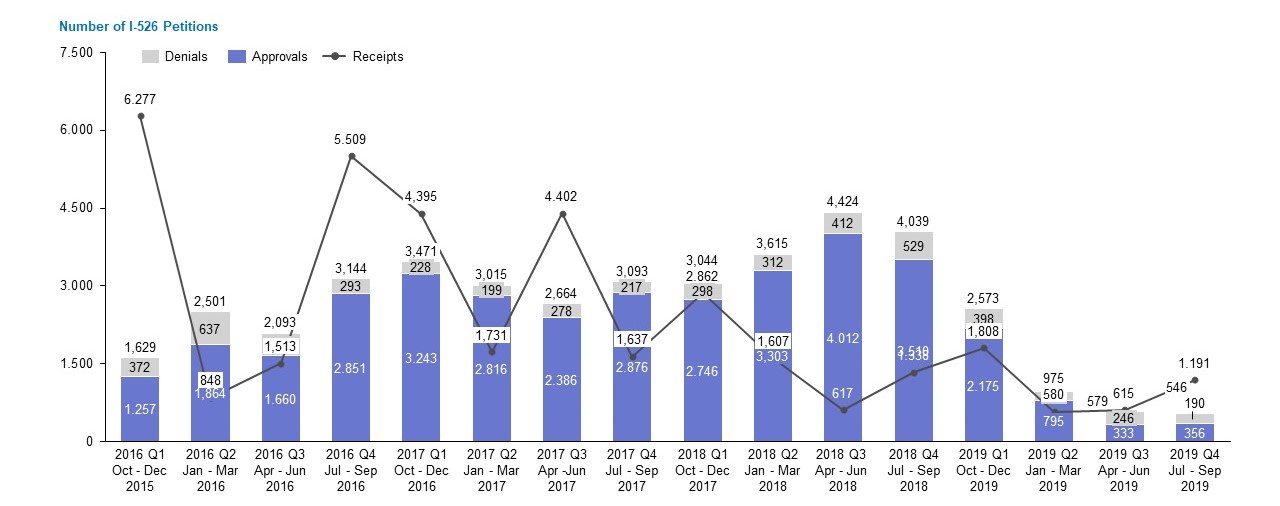
In 2008, a mere 2,873 I-526 Immigrant Petition by Alien Investor petitions were processed (classified as either received, approved, denied, or in pending status), a staggering difference from 2019’s 22,630. The number of petitions received, adjudicated, or in pending status rose steadily and rapidly from 2008 until 2017, when it reached a peak of nearly 50,000. Since 2017, there has been a rapid decline, which may be partially attributable to the large number of petitions in pending status, which totaled close to 25,000 in 2017. In terms of petitions received, 2019 fell below the 2012 figures.
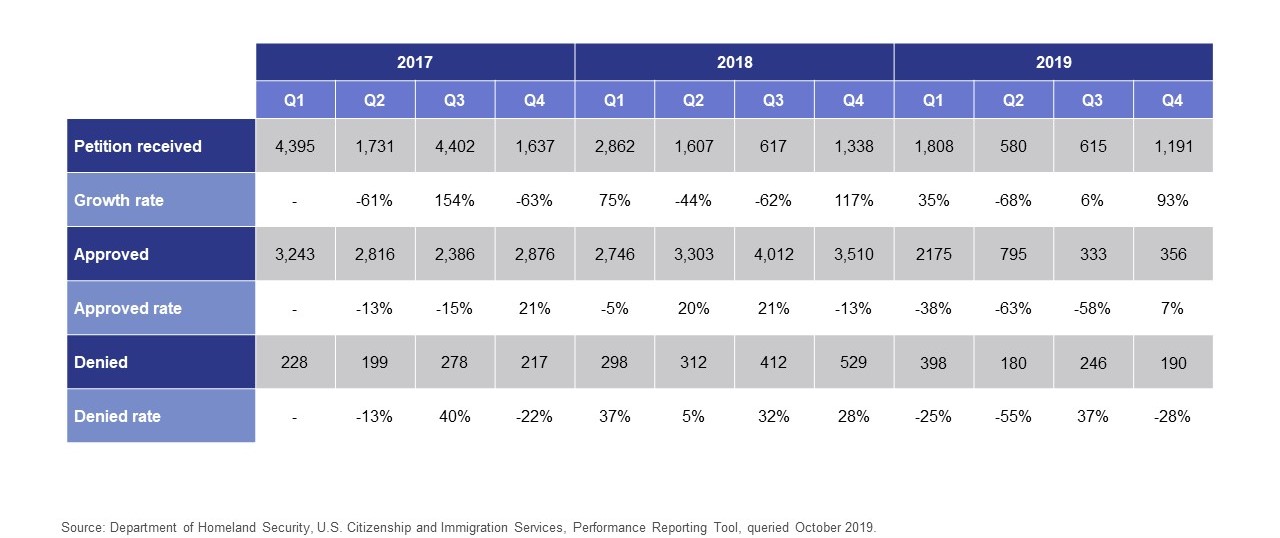
Furthermore, each year, the number of EB-5 approvals has been significantly larger than the number of denials, but the ratio changes from year to year, with 2019 presenting one of the largest denial ratios. The number of petitions adjudicated in 2019 was significantly lower than that of 2018, with the USCIS backlog reduced by only around 600 petitions.
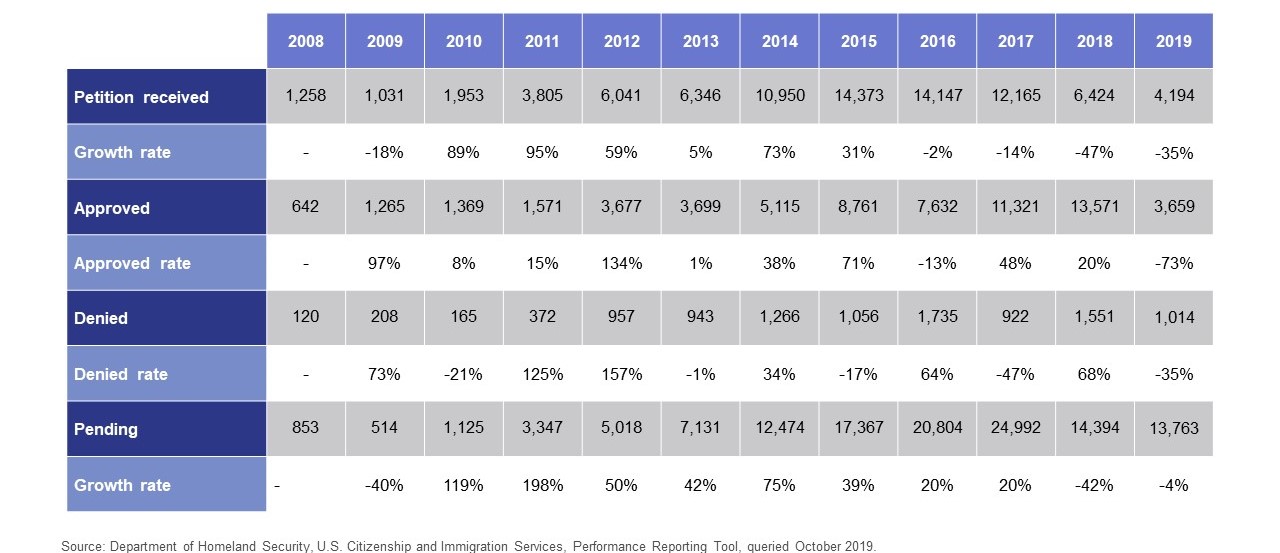
For the most part, the EB-5 program has grown significantly over the past 11 years. Regarding the number of I-526 petitions received by USCIS, growth was steady and generally large from 2010 until 2016, with 2011, 2010, and 2014 recording the highest growth percentages. The trend reversed in 2016 with a small decline, increasing to a large 49% decline in 2018 and continuing with a 35% decline in 2019.
In most years, the approval rate has also grown, with 2016 and 2019 being the only years to record a decline. 2012 saw a massive approval growth rate to the tune of 134%, but 2019’s 73% drop in I-526 approvals is in stark contrast. It is worth noting that the denial rate for I-526 petitions also decreased by 35% in 2019, indicating a drop in the overall number of adjudications.
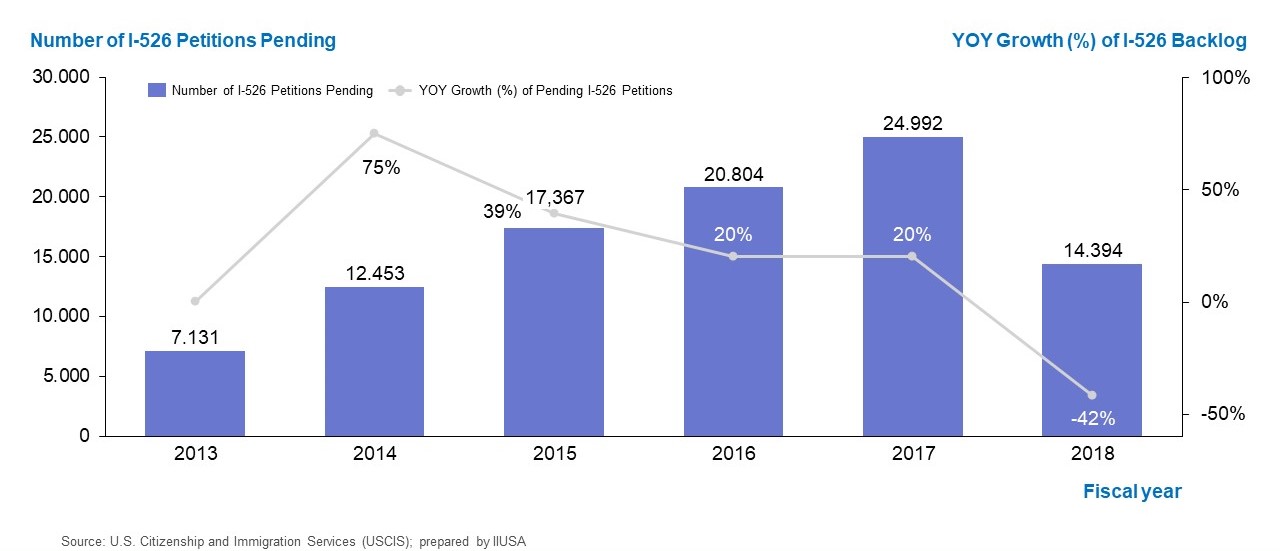
Finally, the backlogs grew rapidly from 2010 until 2017, although growth rates started slowing down in 2015. The number of pending I-526 petitions in 2017 was larger than the total number of petitions processed by the USCIS each year from 2008 to 2013. While the USCIS managed to lower the backlogs by 42% in 2018, it fell by only 4% in 2019.
I-526 Petition Figures Fall in 2019
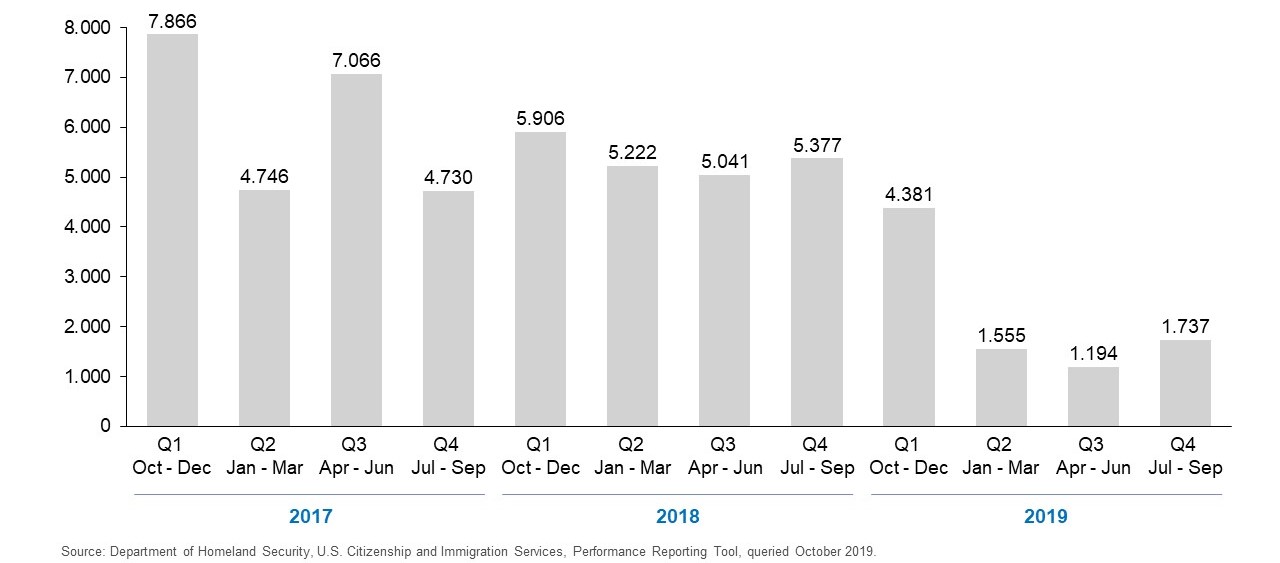
If we look at the total number of I-526 petitions processed by the USCIS per quarter from FY2017 to FY2019, we see that the numbers have generally been decreasing, particularly in FY2019. All FY2019 figures are lower than all figures from the preceding two years, with figures seeing a particularly steep drop starting in January 2019. If USCIS can improve its adjudication rate, the lower number of petitions being received could allow the backlogs to decrease.
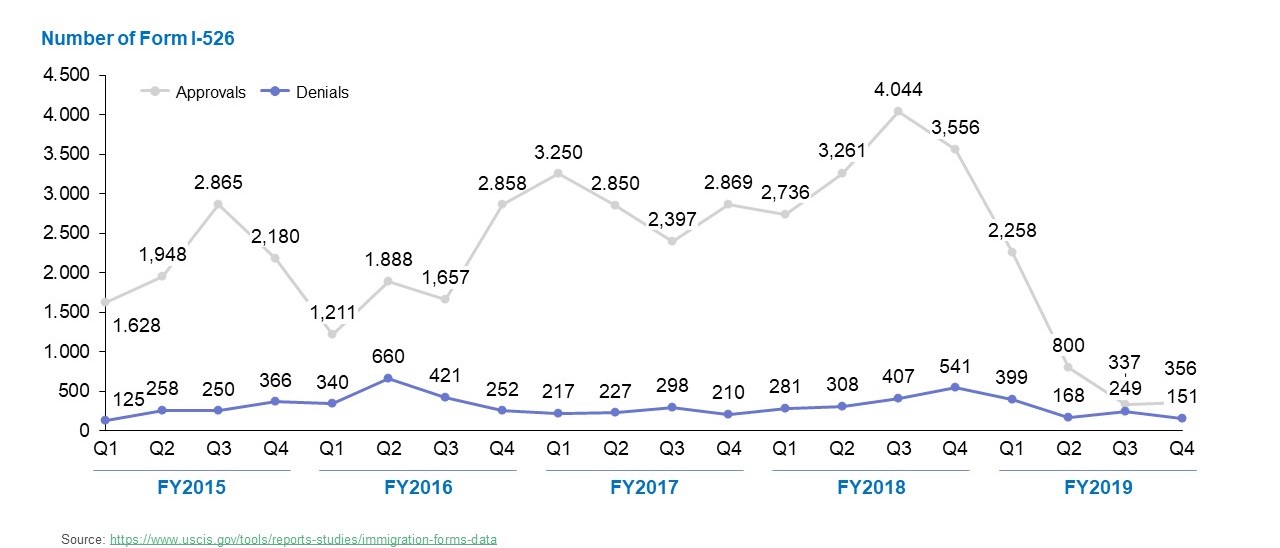
Furthermore, while the number of petitions was significantly lower than previous figures in 2019 Q2 and Q3, the number shot back up in 2019 Q4. The number of adjudicated petitions during this time, however, decreased, which does not bode well for the backlogs. Notably, the number of approvals for the last three quarters of FY2019 was also significantly lower than those of previous quarters, while the denial rates have remained fairly average, so it may be wise for EB-5 investors to exercise caution.
Going back to FY2016, the falling trend for I-526 petition receipts becomes even clearer. In 2016 Q1, 2016 Q4, and 2017 Q3, the number of receipts was significantly higher than the number of adjudications, but since 2017 Q4, the number of receipts has generally been lower. It was higher in 2019 Q4, but that may be only because of the abnormally low number of adjudications throughout the year—had FY2019 seen adjudication rates closer to those of previous years, the adjudication rate would have been higher than the rate of receipt. The number of adjudications reached a peak in 2018 Q3 and has since declined dramatically to a record low for the studied period in 2019 Q3.
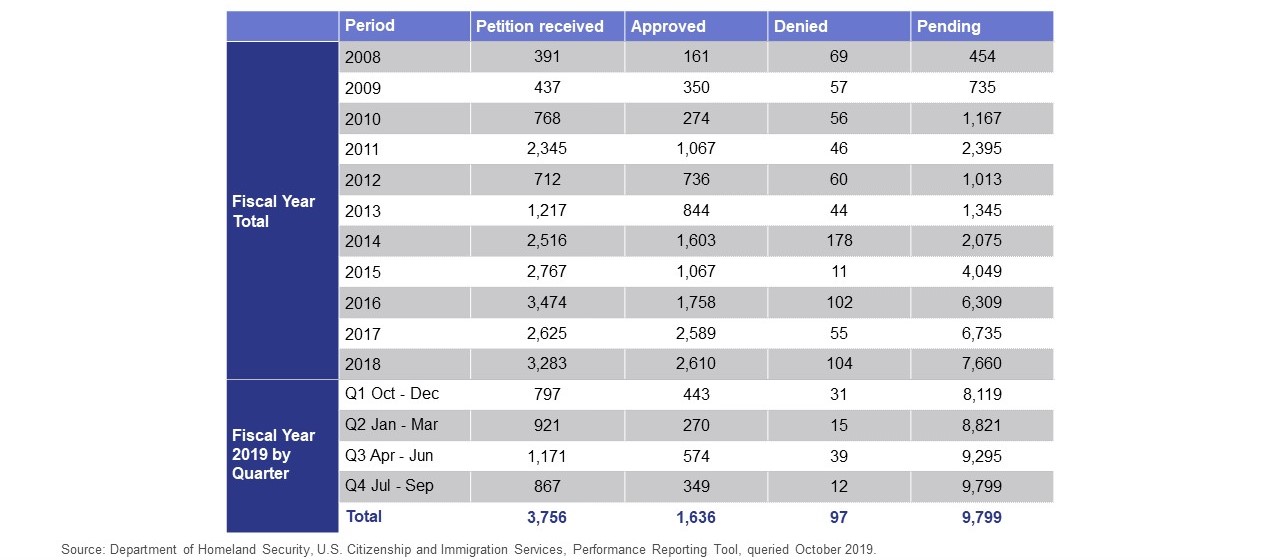
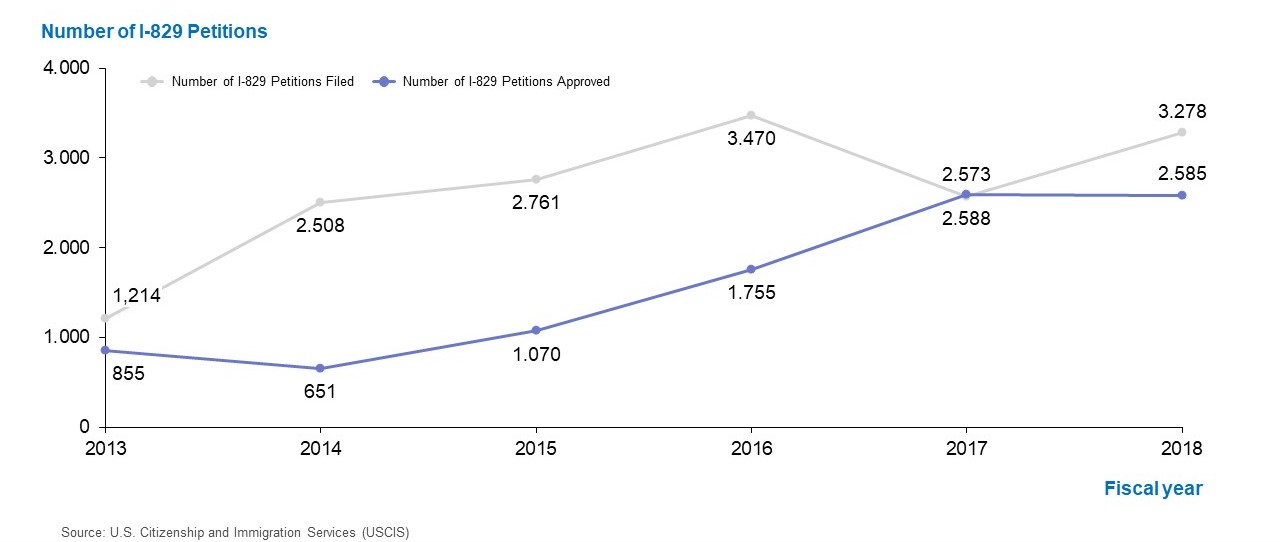
I-829 Petitions Experience Steady Growth
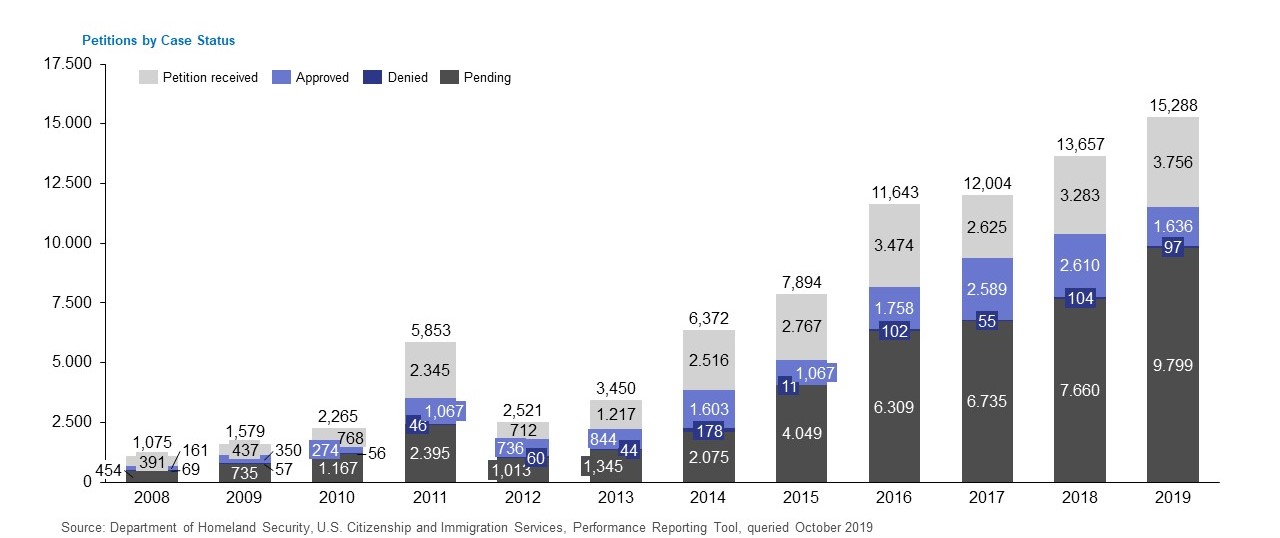
The overall growth of the EB-5 visa program is also evident in the number of I-829 Petition by Investor to Remove Conditions on Permanent Resident Status petitions processed by USCIS between 2008 and 2019. With the exception of a sudden boom in 2011, after which figures returned to near 2010 levels, the total number of petitions has grown steadily year after year since 2008. This means the backlog has also grown steadily, reaching almost 9,800 in 2019. The growing I-829 backlogs have not quelled the flow of incoming petitions, however, with 2019 recording the highest figure during the studied period at 3,756.
In general, the reception and adjudication of I-829 petitions has grown during the period of 2008 to 2019. The number of I-829 petitions received by USCIS grew each year except for 2012 and 2017, although 2012’s negative growth rate is largely due to the stark difference compared to the abnormal spike in 2011, which recorded a 205% growth rate from 2010.
Approval rates grew in most years as well, with only 2010, 2012, 2015, and 2019 showing declines. 2019’s negative growth rate of -37% for approvals is the largest in the entire 11-year period. Denial rates exhibited more fluctuation, recording massive growth rates of 305% and 827% in 2014 and 2016, respectively. Typically, if approval rates are down for a year, the denial rates are as well, and that is true for 2019, which saw a -7% growth rate for denials to accompany the -37% growth rate for approvals.
Finally, the number of pending applications has grown every year except 2012, which may be attributable to 2011’s spike. Since then, it has risen each year, with a 95% growth rate in 2015 and 28% in 2019. With adjudication rates falling and backlogs continuing to increase, EB-5 investors may be subjected to even longer waiting times.
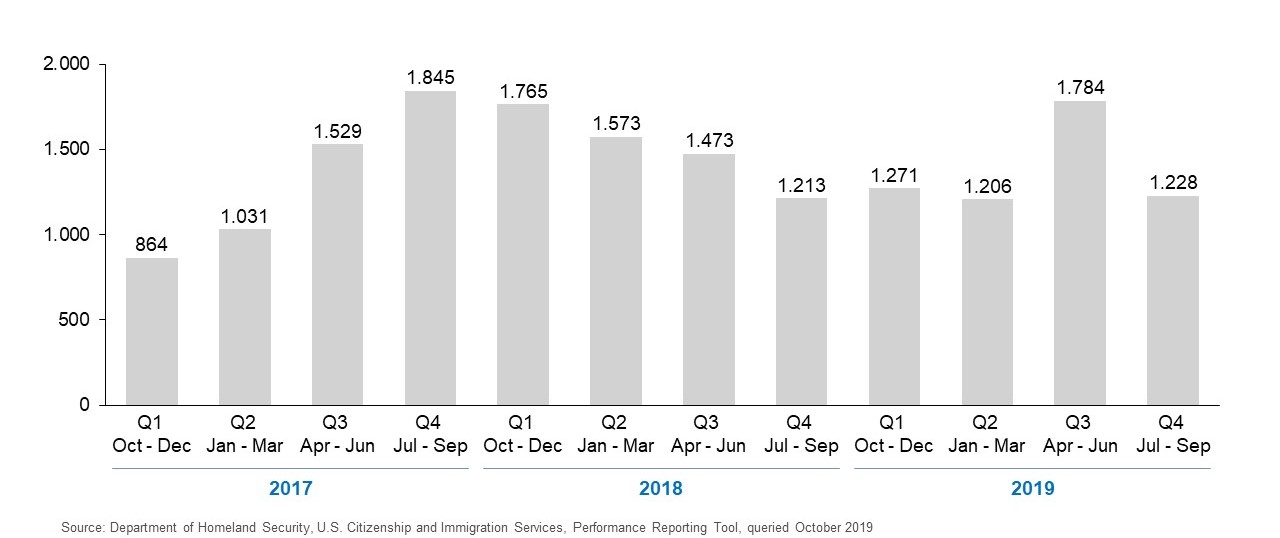
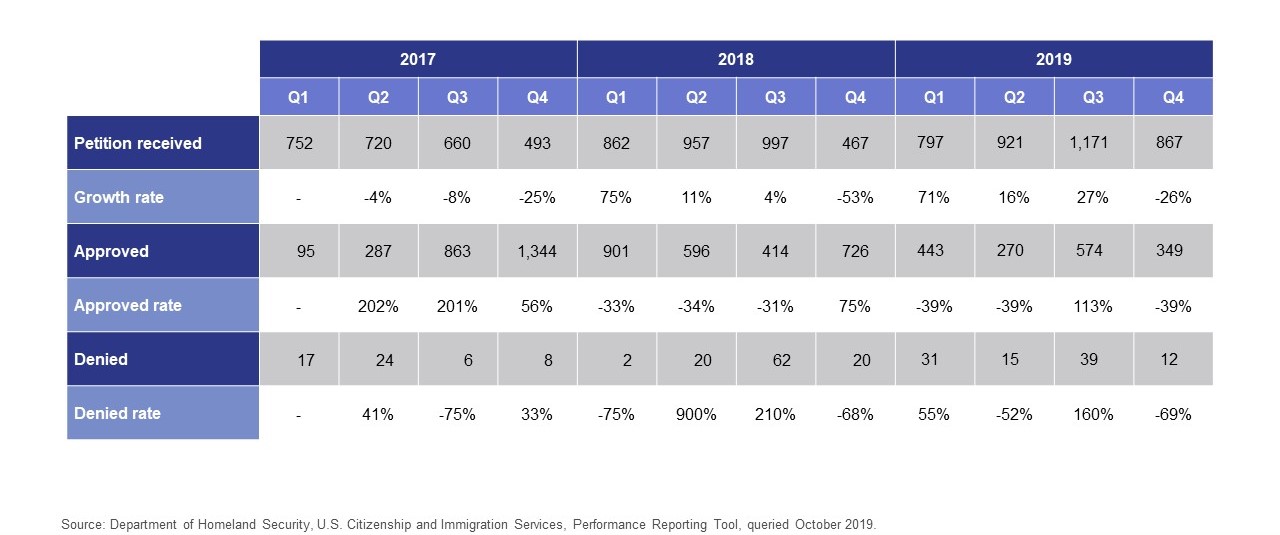
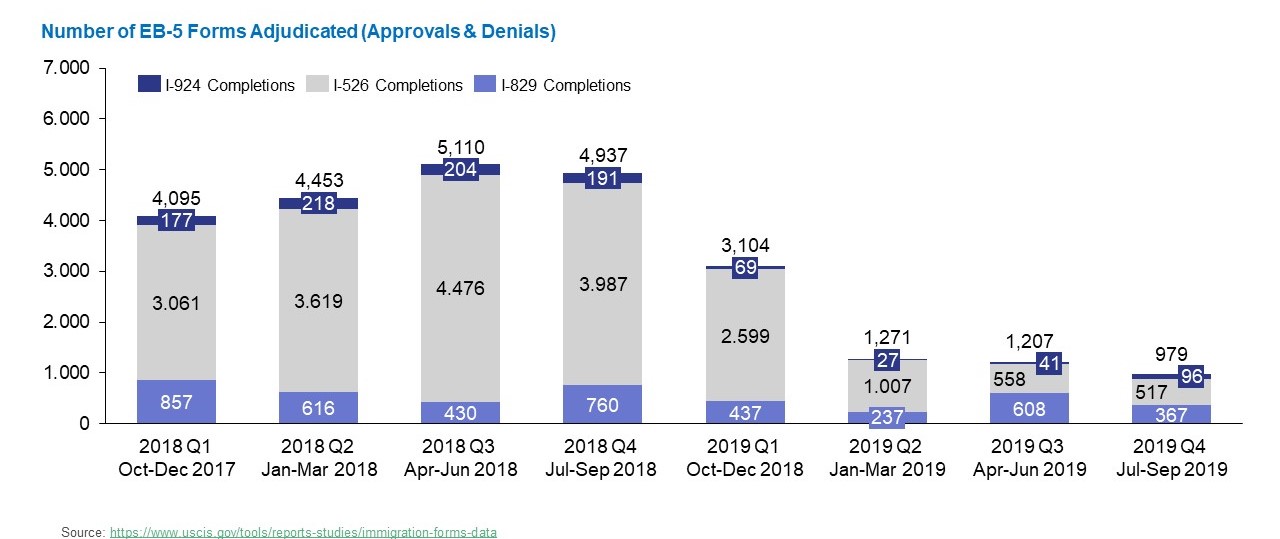
I-829 Petitions See High Approval and Receipt Rates
In contrast to the falling numbers of I-526 petitions, figures for I-829 petitions have remained relatively steady over the FY2017–FY2019 period. The total number of petitions peaked in 2017 Q4 at 1,845 and have, since 2018 Q4, remained stable at around the 1,200 level, with the exception of a jump to 1,784 in 2019 Q3.
The number of I-829 petitions received has generally been growing, with FY2019 seeing the highest total figures in the three-year period, including the only number above 1,000 in Q3. Figures grew steadily to 1,171 in 2019 Q3 following a 53% drop in 2018 Q4.
The growth rates for approvals during the 2017–2019 period were generally large, regardless of the direction, with the smallest growth rate at 39% (negative growth) in the first, second, and fourth quarters of FY2019. The largest was in 2017 Q2 at 202% (positive). In the last two quarters of FY2017, as well as the first and last quarters of FY2018, approval rates were higher than the number of I-829 petitions received.
Denial rates have witnessed fluctuating growth rates due to their small numbers: The largest number of denials for any quarter during the period was 62. In all years, the number of denials has been significantly smaller than the number of approvals, with the largest difference in 2018 Q1, where there were 901 approvals and two denials.
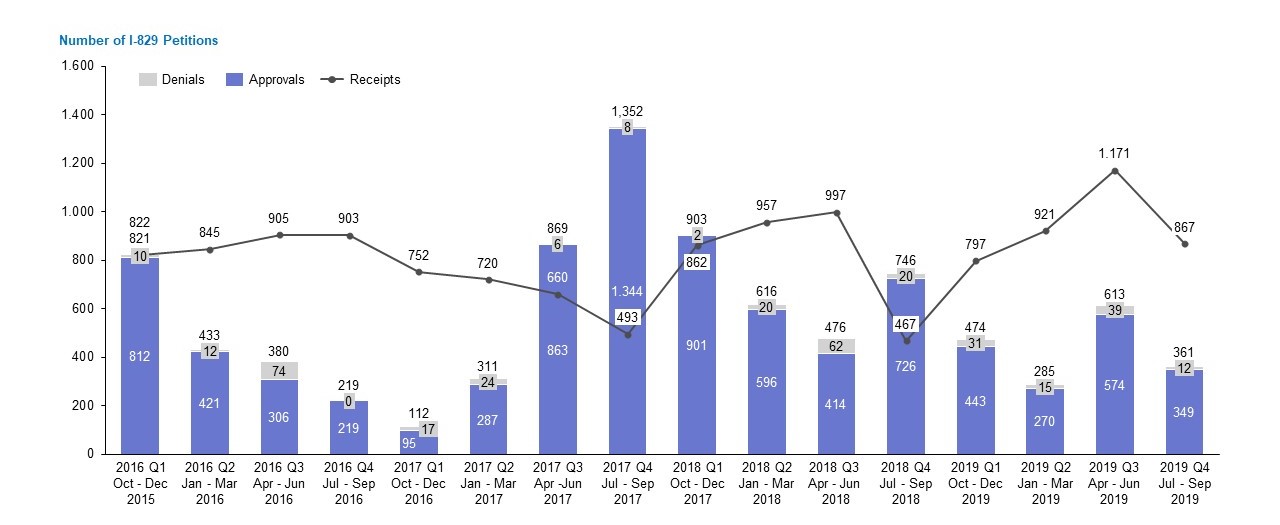
The quarterly bar graph for I-829 petitions makes clear the large number of approvals over denials, with each bar almost entirely blue, signifying approvals. Adjudication rates slowed down in FY2016 but picked up dramatically in FY2017, particularly in Q4, and have fallen with fluctuations ever since. The rate of receipts has also seen fluctuations but has remained at relatively the same level, generally above the number of adjudications for the respective quarter. The clear outlier in this regard was 2017 Q4, which saw 1,352 adjudications and a mere 493 receipts. For the entirety of FY2019, the number of receipts has been well above that of adjudications.
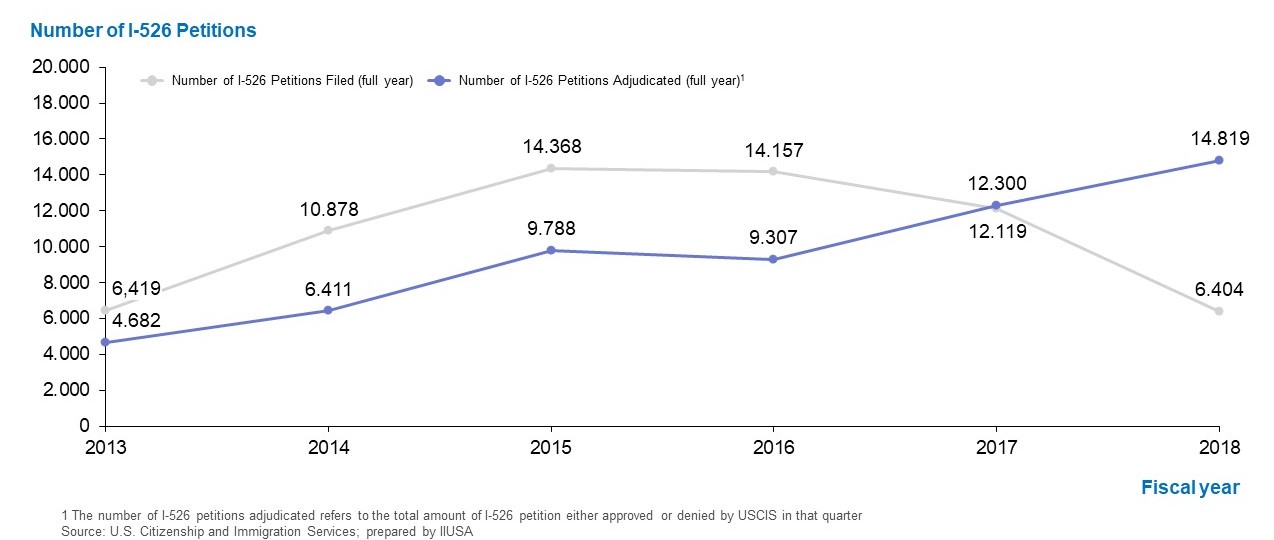
I-526 Receipts Fall, Approval Rates Drop Significantly
When looking at a line graph of I-526 adjudications vs. receipts for the period of FY2013 to FY2018, we can see what appears to be a trend reversal starting in FY2017. Receipts grew from FY2013 and reached a plateau in FY2015 and FY2016 before decreasing slightly in FY2017. From there, receipts nearly halved, with FY2018 figures even lower than FY2013 figures. Meanwhile, adjudications are shown to have risen almost every year, with the exception of FY2016, when I-526 adjudications were slightly lower than in FY2015. Until FY2016, receipts were significantly higher than adjudications, but the figures were roughly even in FY2017, and FY2018 saw far more adjudications than petitions. However, the omission of FY2019 EB-5 data makes this graph somewhat misleading, as previous graphs have indicated that adjudications dropped drastically in FY2019, falling back below the number of receipts, which also decreased.
Unlike the previous graph, this line graph of I-526 approvals and denials does include FY2019 data, which starkly contrasts with the data of preceding years. For every year since FY2015, approval rates have been higher than denial rates, significantly so until FY2019. Although FY2016 saw increased denials and fewer approvals, the difference remained high and shot back up in FY2017 and FY2018. Starting in 2019 Q1, the approval rate took a nosedive, which continued in Q2, and in Q3, there were only 88 more approvals than denials. This rate improved slightly in Q4 but remains significantly lower than in all previous years in the period.
I-526 Backlog Begins to Decrease
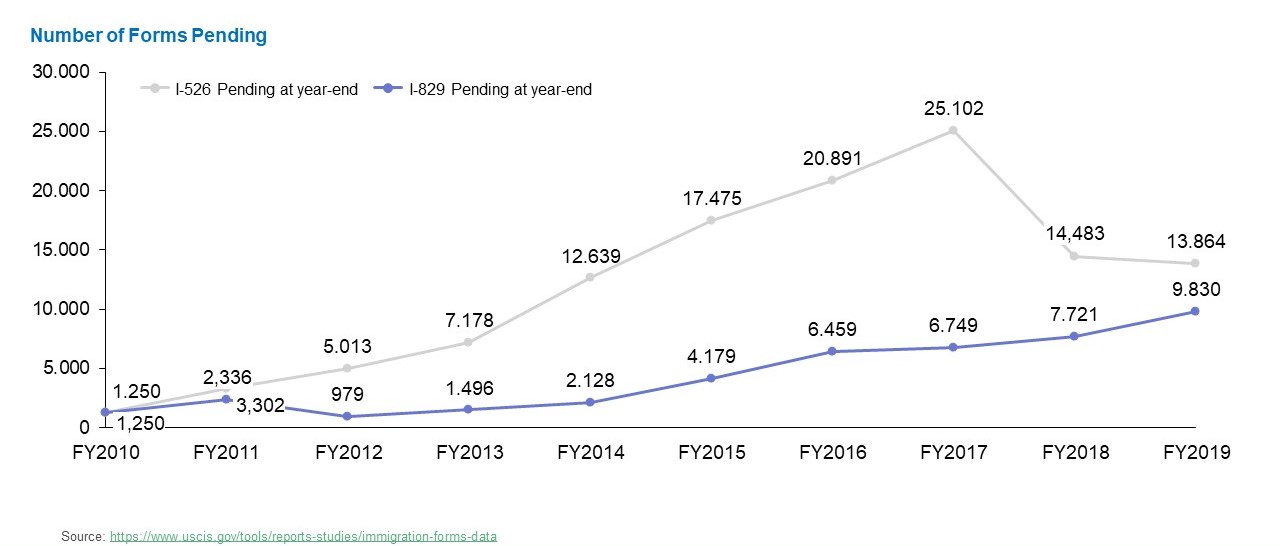
Regarding the USCIS I-526 backlogs, which have grown to unprecedented heights in recent years, growth rates are shown to be slowing. The most dramatic growth was seen in FY2014, where the backlog grew by 75%. From FY2015 to FY2017, while pending I-526 petitions grew by the same amount as in FY2014 in terms of the actual numbers, the growth percentage was lower, falling to 20% in FY2016 and FY2017. Only FY2018 saw a decrease, and a dramatic one at that, recording a negative growth rate of 42% and taking the number of pending I-526 petitions back down to pre-FY2015 levels. Had the FY2019 data been included, we would see the downtrend continuing but weakening significantly, with the number of pending petitions decreasing by only 4%.
I-829 Approval Rates Remain Staggeringly High
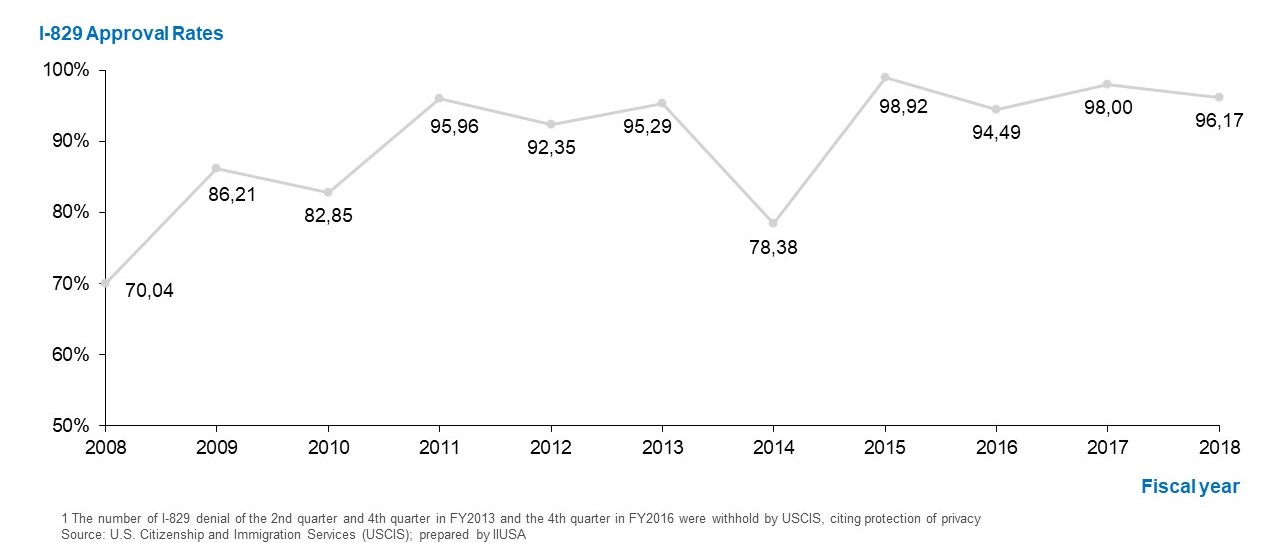
As the first of these two charts illustrates, the approval rates for the I-829 petition are staggeringly high, with percentages in the 90s for most years between FY2008 and FY2018. The lowest percentage—70%—came in FY2008, after which the rate reached 95% in FY2011. FY2014 saw a sudden dip, shooting back down to 78% from 95%, while FY2015 witnessed an astounding approval rate of nearly 99%.
However, as the second chart reveals, while approval rates are high, the backlog is also steadily growing. For most years from FY2013 to FY2018, approval rates remained consistently below the receipt rate by hundreds of petitions, reversing only in FY2017 by a mere 15 petitions. FY2017’s reversal was due to a drop in receipts rather than an abnormally high increase in approvals, however, and when receipts picked back up in FY2018, approvals plateaued, which is not good news for the ever-increasing I-829 backlog.
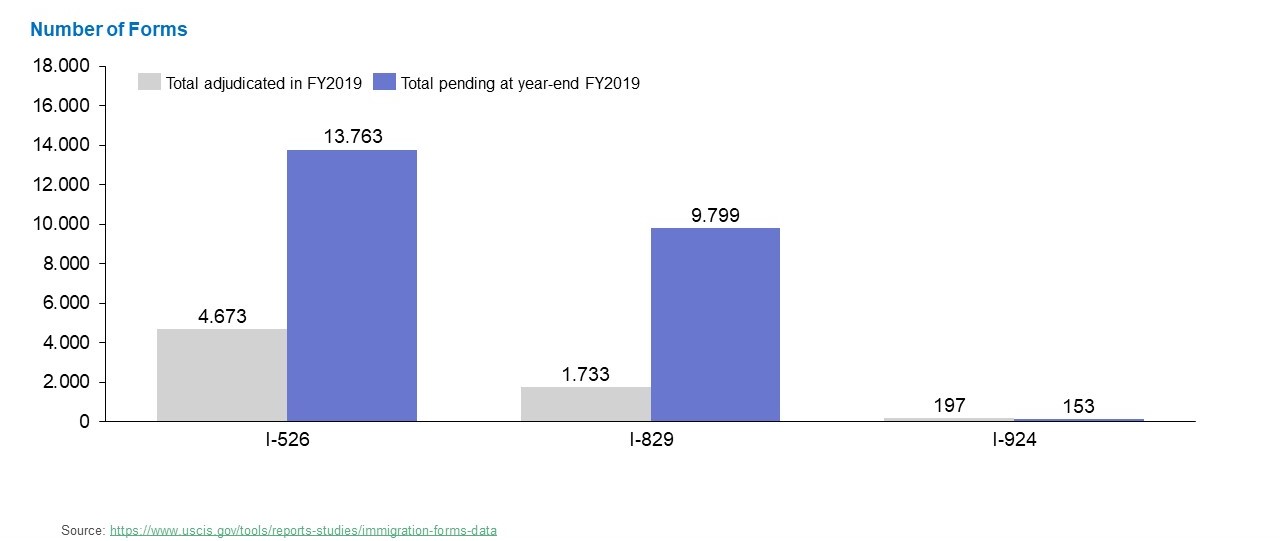
USCIS Adjudications Consistently Low in 2019
The USCIS adjudicated an extremely low number of EB-5 forms, regardless of the type, throughout the entirety of FY2019. While previous graphs have shown the beginnings of a downtrend in the I-526 backlogs, sparked by a large number of adjudications in FY2018, the number of I-526 petitions pending is still almost triple the number adjudicated as of the end of FY2019. Similarly, for I-829 petitions, the number of pending petitions is more than five times the number of those adjudicated, and the backlog for I-829 has been exhibiting steady growth. For the much less filed I-924 petition, however, more petitions were adjudicated than are pending.
Completion numbers for all three EB-5 forms are were down in FY2019, dropping to below 1,000 in total in 2019 Q4. While in FY2018, the total figures for each quarter were above 4,000, 2019 Q1 saw a steep drop, which continued in Q2. Figures have remained steady since 2019 Q2, so if USCIS does not pick up the adjudication pace in 2020, the state of the backlogs will depend on the number of petitions received.
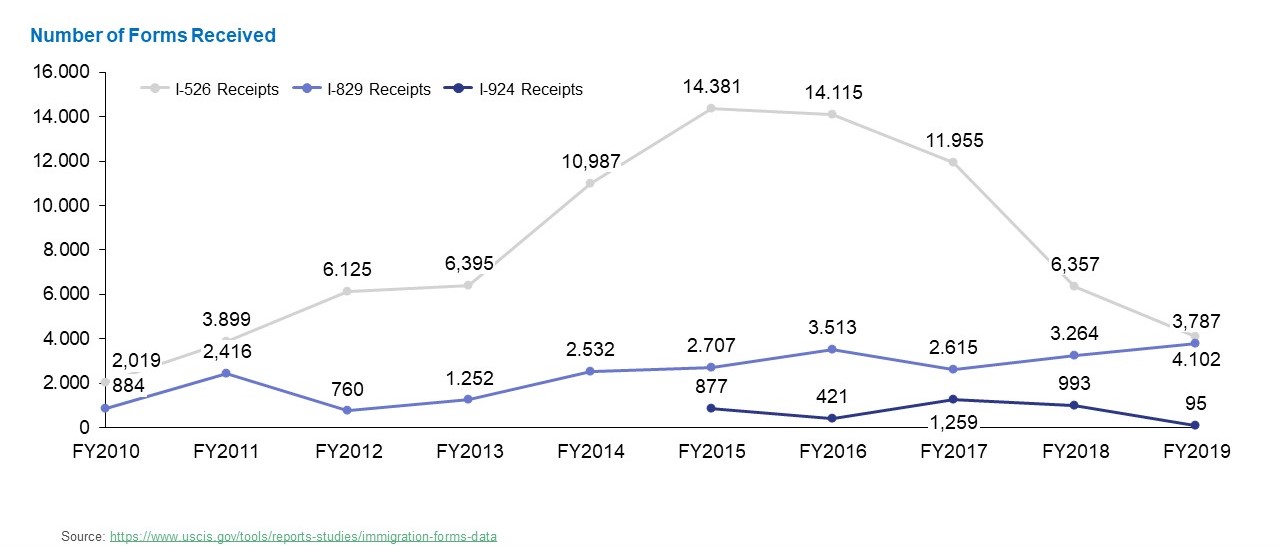
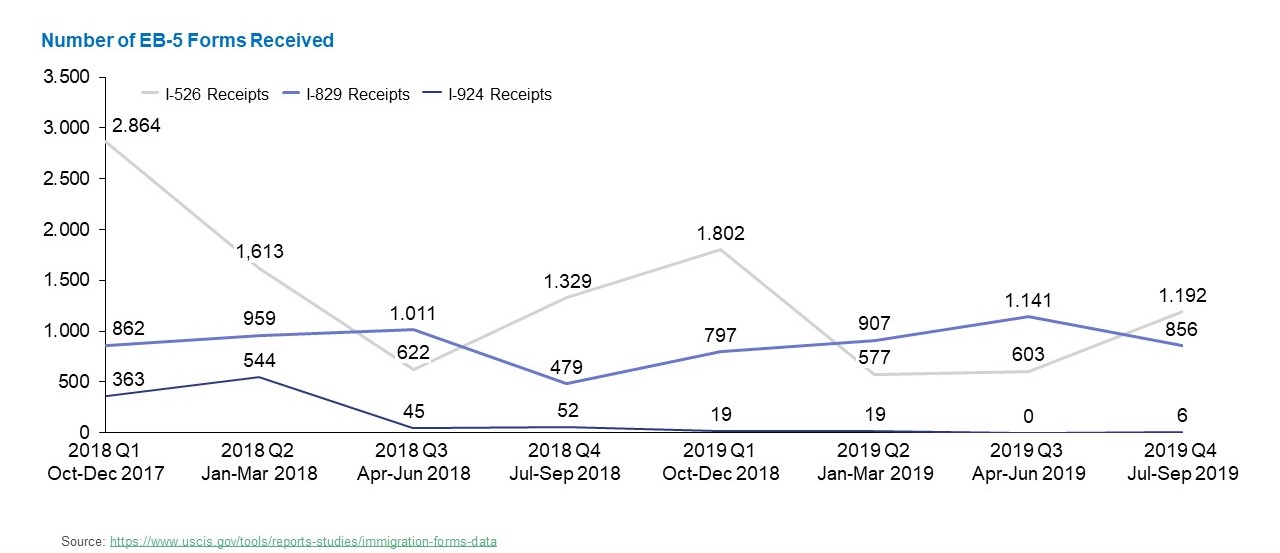
I-526 Petition Receipts Drop While I-829 Petition Receipts Slowly Rise
Ever since FY2010, the beginning of the studied period, I-526 receipts have been well above I-829 receipts, but this trend threatens to reverse as we move into FY2020. In FY2012, I-526 receipts rose while I-829 receipts fell, and in FY2014, I-526 receipts shot up dramatically, while I-829 receipts continued along a slow upward trend. I-526 receipt rates began to fall in FY2017 before plummeting in FY2018, continuing their fall into FY2019. Meanwhile, I-829 receipt rates have been relatively steady, increasing slowly since a small drop in FY2017. If these trends continue, I-829 receipts are poised to overtake I-526 receipts in FY2020.
Since their introduction in FY2015, I-924 Application For Regional Center Designation Under the Immigrant Investor Program petitions have been significantly lower than their counterparts. While I-924 petition receipts saw an increase in FY2017 to over 1,000, the figure plummeted to an unprecedented low in FY2019 with only 95 receipts.
The quarterly breakdown shows heavier fluctuation, with I-829 petitions overtaking I-526 petitions in 2018 Q3, 2019 Q2, and 2019 Q3. I-516 petition receipts spiked in 2019 Q1 but remained low for the remainder of the fiscal year, although they did see an increase in Q4, putting the I-526 figures back above those for I-829. The I-829 receipt rate remained more stable throughout the period, decreasing somewhat at the end of FY2019.
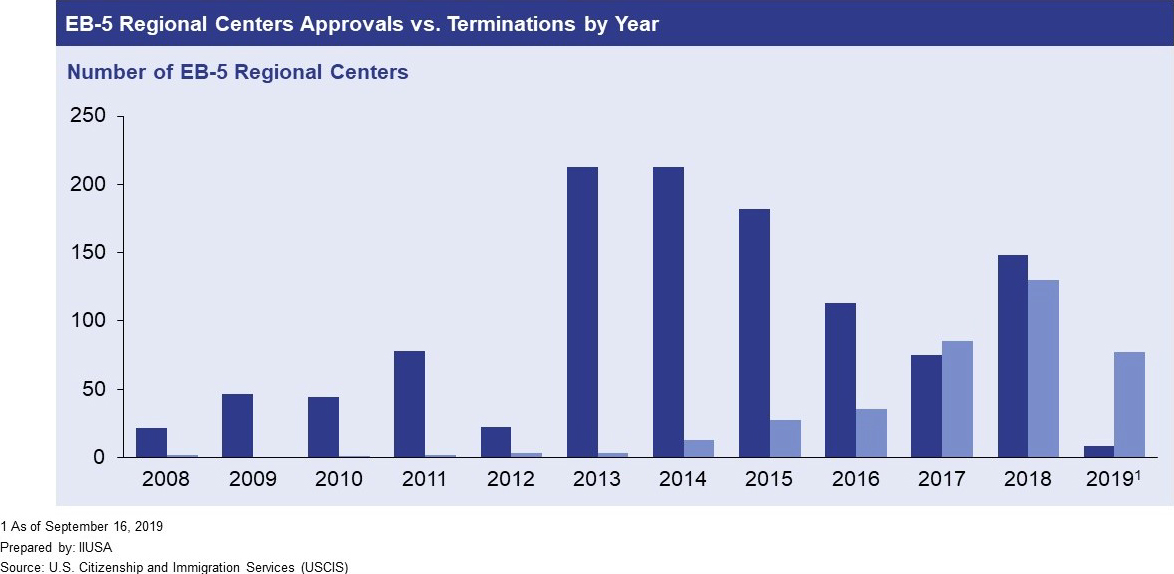
Particularly noteworthy is the sudden decline in I-924 petitions for regional center designation in FY2019. In no quarter were the figures above 20, and in Q3, not a single I-924 petition was received by USCIS. The sudden drop in I-924 petition receipts is likely related to the new USCIS regulations that have increased the required EB-5 investment amount and restricted TEA designation, which has resulted in an unprecedentedly high number of regional center terminations.
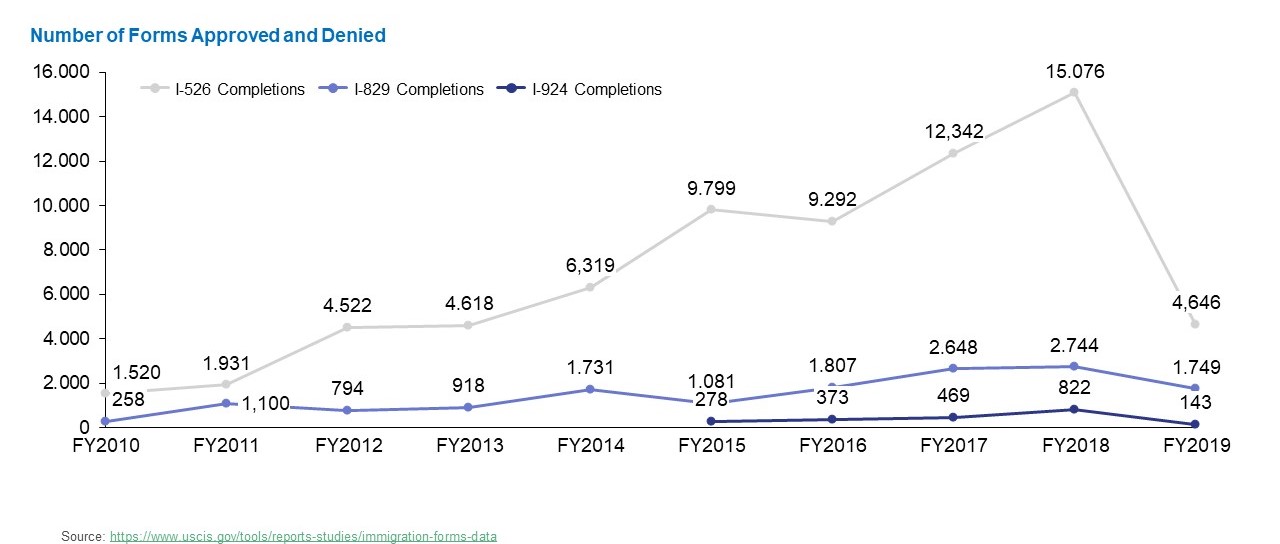
USCIS Adjudications See a Steep Decline, Backlogs Still Large
For the majority of the period between FY2010 and FY2019, USCIS adjudicated an increasingly large number of I-526 petitions. For the most part, the number rose year over year throughout the decade, with USCIS adjudicating an impressive 15,076 I-526 petitions in FY2018. However, the trend reversed dramatically in FY2019 with the steepest drop in the entire decade, falling to only 4,656, on par with FY2013 levels. Although receipts also dropped in FY2019, the huge backlog meant that USCIS still had an overabundance of petitions waiting for adjudication, indicating that the drop is due to UCSIS slowing down its adjudication rates.
The number of I-829 petitions adjudicated was also down in FY2019, but not significantly, and the drop is not abnormal for the relatively stable I-829 adjudication rate seen throughout the decade. The I-924 adjudication rate, like that of the I-829 petition, was consistently much lower than that of the I-526 but reasonably stable throughout the period.
It is also clear that while the I-526 backlog was fairly small in FY2010 and FY2011, it started shooting up in FY2012, rising steadily for years until peaking in FY2017. In FY2018, USCIS completed an abnormally high number of I-526 petitions, bringing the backlog down significantly, but it decreased only marginally in FY2019, meaning USCIS is going into FY2020 with a large I-526 backlog still looming overhead. Meanwhile, while the I-829 backlog has never reached the same heights as the I-526 backlog, it has been climbing steadily year over year, with no declines since FY2012. If growth continues at the current rate, the I-829 backlog is poised to overtake the I-526 backlog within a year or two.