
EB5AN State of South Carolina Regional Center
Geographic Coverage: All 46 Counties in the State of South Carolina
View the official regional center designation letter for the EB5AN South Carolina Regional Center.
Contact us now to learn more about becoming a business affiliate.

Benefits of Affiliation with Our South Carolina EB-5 Regional Center
Immediate Ability to Raise EB-5 Capital in South Carolina
Business affiliates of EB5AN, including our South Carolina EB-5 regional center, can immediately begin raising EB-5 investment funds in any of the designated geographic areas that comprise our USCIS-approved regional centers.
Indirect Job Creation Calculations
Business affiliates of our regional centers can calculate job creation through both direct and indirect job methodologies. This leads to higher job creation figures than direct non-regional center calculations of actual payroll employees.
Regional Center Affiliation Process
The regional center affiliation process can be a fast solution and a great fit for those looking to begin a project immediately. The benefits of affiliating with a regional center make this an excellent choice for many project developers.
Our experienced team will work with you to understand whether EB-5 funding is a good fit for your project and whether you qualify to affiliate with our regional centers.
Let Us Help You to Create Your Own South Carolina EB-5 Regional Center
Our Team Will Complete Your I-924 Application for a South Carolina EB-5 Regional Center in Three Weeks
EB5AN has obtained full state regional center coverage in multiple states and has completed more than 100 USCIS-compliant business plans and economic impact studies. The I-924 application process is complicated and requires legal expertise, economic analysis, business plan creation, and an understanding of how USCIS adjudicates applications.
EB5AN has the internal resources to assemble all required aspects of an I-924 application. Additionally, we have extensive experience with I-924 applications and understand all the key components and common pitfalls.
There are various approaches to take when filing an I-924 form; please contact us to learn more about the process and how we can work together to get your regional center approved quickly by USCIS.
Targeted Employment Area (TEA) Qualification Report in South Carolina for EB-5 South Carolina Regional Center Projects
Please visit our EB-5 TEA Map to determine whether your South Carolina EB-5 regional center project’s location qualifies as a rural or high unemployment targeted employment area (TEA).
Free Targeted Employment Area Map for all 50 States
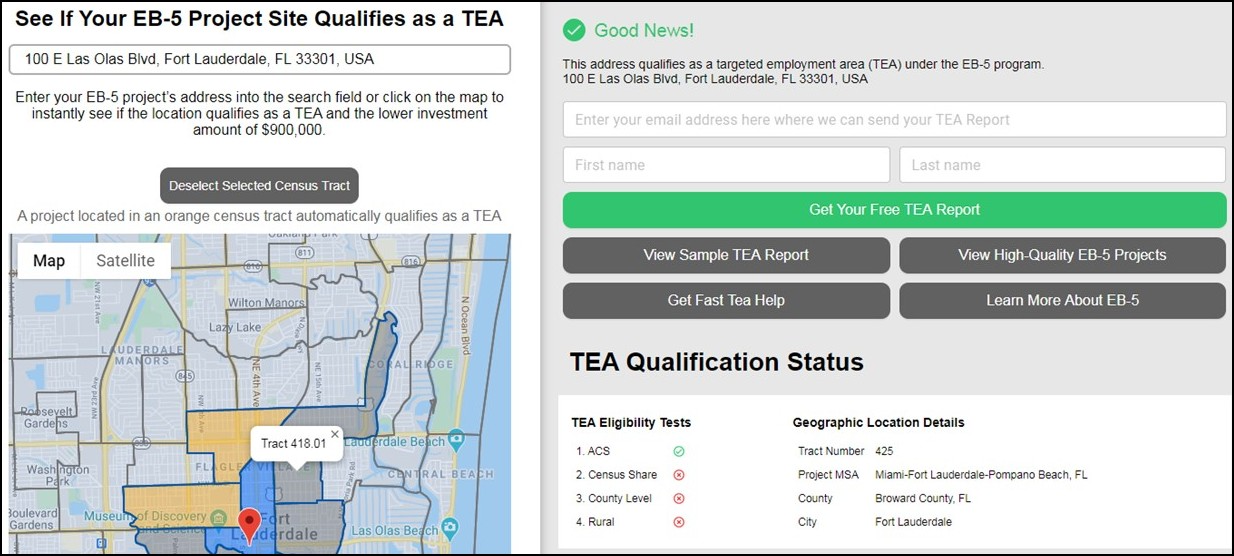
Click image to view the TEA map and instantly download a free TEA qualification report.

![]()
Because TEA designation is crucial to the success of many EB-5 projects, it is important to understand how USCIS reviews TEA designation requests. Once you determine whether your South Carolina EB-5 regional center project is located in a TEA, you can prepare a TEA report yourself. The free downloadable report available through the EB5AN TEA map is also suitable for submission to USCIS.
If you still need assistance with preparing your EB-5 TEA report for your EB-5 regional center project in South Carolina, please contact the EB5AN team directly by phone at 1-800-288-9138 or via e-mail at info@eb5an.com, or simply order an EB-5 TEA Qualification Report.
About the State of South Carolina and the Economic Climate of Our EB-5 South Carolina Regional Center
The EB5AN South Carolina EB-5 regional center was created to provide an investment vehicle for qualified foreign investors seeking to obtain permanent resident status in the United States through an investment in a USCIS-approved EB-5 regional center with geographic coverage of all 46 counties in the State of South Carolina.
Historically, several elected South Carolina public officials, including senators and congressional representatives, have endorsed the EB-5 regional center program as a great opportunity for the U.S. economy and for foreign investors who want to immigrate to the United States and invest in a USCIS-approved South Carolina EB-5 regional center such as the EB5AN South Carolina Regional Center.
South Carolina: Population and Income Demographics
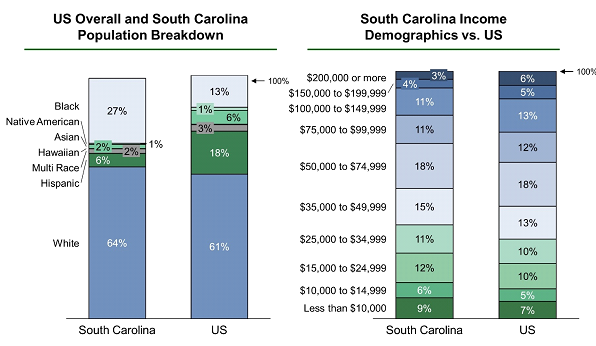
According to the 2010 U.S. Census, South Carolina has a population of approximately 3.87 million people over the age of 16. Within this group, approximately 2.4 million people are in the labor force, with 2.1 million who are employed and 0.2 million unemployed. These population numbers represent approximately 1.8 million households
South Carolina: Unemployment Trends
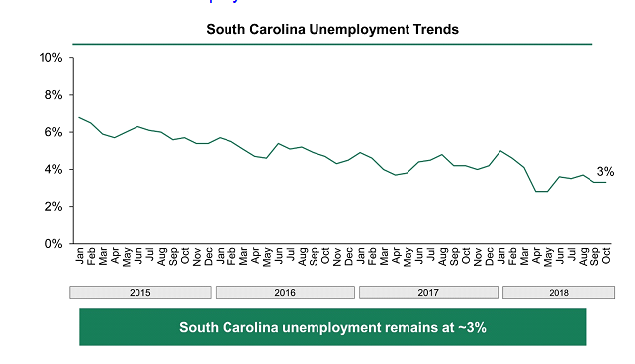
Unemployment statistics for 2018 show average unemployment for South Carolina at around 3.0%. Monthly unemployment rates in 2018 were 3.1% for September and 3.1% for October.
South Carolina covers an area of 32,030 square miles, with a width of 200 miles and a length of 260 miles. This implies a population density of 153.9 people per square mile, which makes South Carolina the 19th-most densely populated state in the United States.
The capital of South Carolina is Columbia, the largest city is also Columbia, and the largest metro area is the Charlotte metro area. The gross domestic product (GDP) of South Carolina in 2010 was $162 billion. This implies a compound annual growth rate from 2000 to 2010 of 4.51% and a per capita GDP of $37,063. South Carolina has the 26th-largest economy in the United States by GDP.
In the 20th century, manufacturing, healthcare, retail, education, hospitality, construction, and professional services have contributed to South Carolina’s economic development. The economy of South Carolina is driven almost entirely by its seven metropolitan areas. In 2004, they produced a combined total of 95.7% of the state of South Carolina’s domestic product.
South Carolina State Government & EB-5 Investment Financial and Employment Statistics
South Carolina: Real GDP (2011–2014)
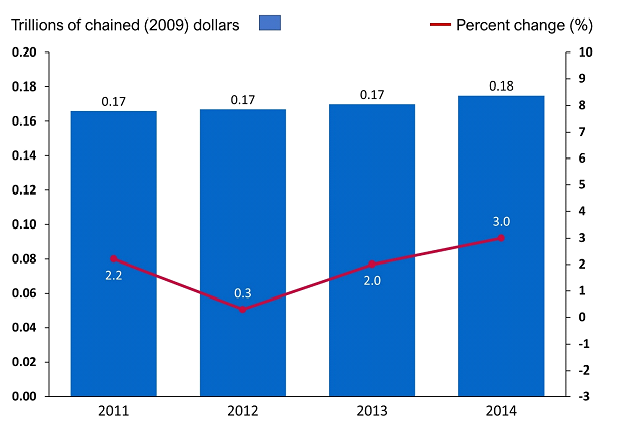
From 2011 to 2014, South Carolina’s GDP grew by 5.32%, with an average annual GDP growth of 1.77%. In 2014, South Carolina’s real GDP was $0.175 trillion, ranked 26th in the U.S. The 2013–2014 financial year saw the largest percent change in GDP at 3.0%, signaling a strong and growing economy.
South Carolina: Total Personal Consumption Expenditure (2012–2014)
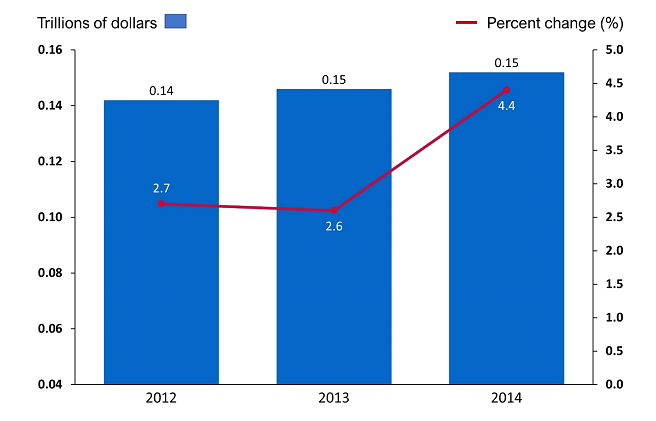
Personal consumption expenditure is the primary measure of consumer spending on goods and services and is a primary engine driving economic growth. South Carolina’s personal consumption expenditure grew from $0.14 trillion in 2012 to $0.15 trillion in 2014. From 2013 to 2014, total personal consumption expenditure grew by 4.4%.
South Carolina: State Government Finances (2013)
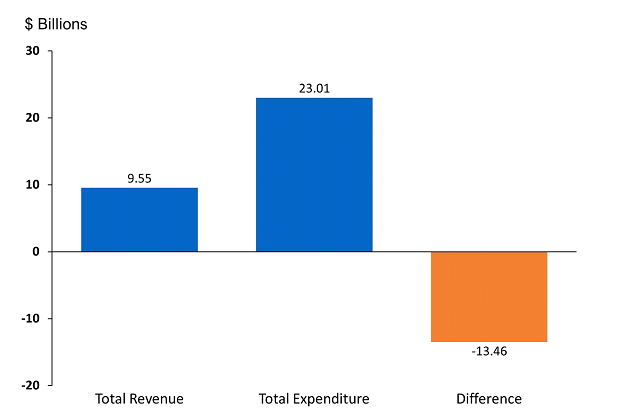
In 2016, the government of South Carolina collected $9.55 billion and spent $23.01 billion, resulting in a difference of $13.46 billion. Revenue is sourced from federal and local taxes, sales tax, and individual and corporate taxes. Expenditures include education, welfare, highways, police, and other social services.
South Carolina: Total Economic Impact of EB-5 Investments (2013)
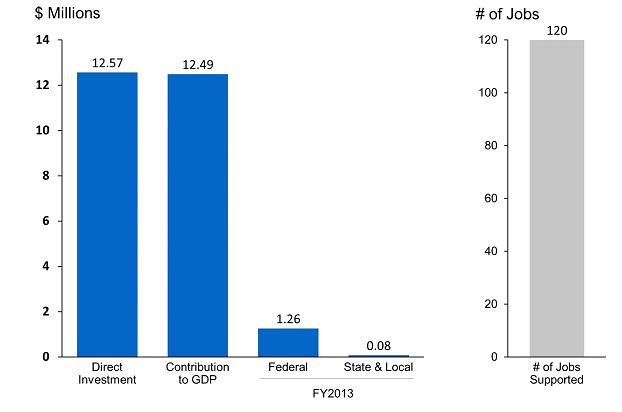
In South Carolina, EB-5 investment has supported the direct creation of 120 jobs. These jobs were the result of roughly $12.57 million in direct investment from EB-5 projects, contributing $12.49 million to the state’s GDP. EB-5 investment in South Carolina also contributed $1.26 million to federal revenue and $.078 million to South Carolina state government and local municipal revenue.
South Carolina: New Privately Owned Housing Units Authorized by Building Permits in Permit-Issuing Places
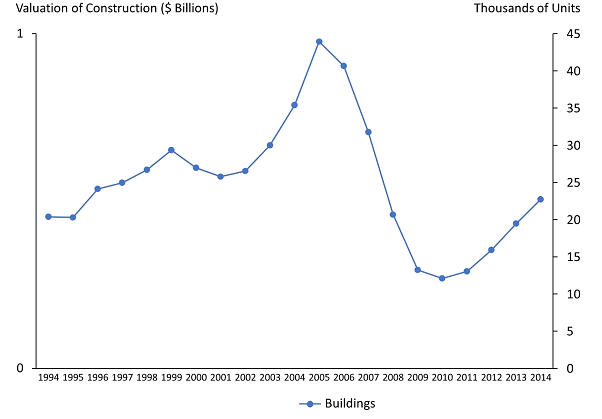
Since 2009, South Carolina has seen increased growth of privately owned housing units, both in new buildings and housing units. In 2014, roughly 24,000 privately owned units were authorized by building permits. Most of these units are in South Carolina’s largest cities, which include Columbia, Charleston, North Charleston, and Mount Pleasant.