.jpg)
EB-5 Regional Center Market Concentration
EB-5 Regional Center Distribution by State 2015
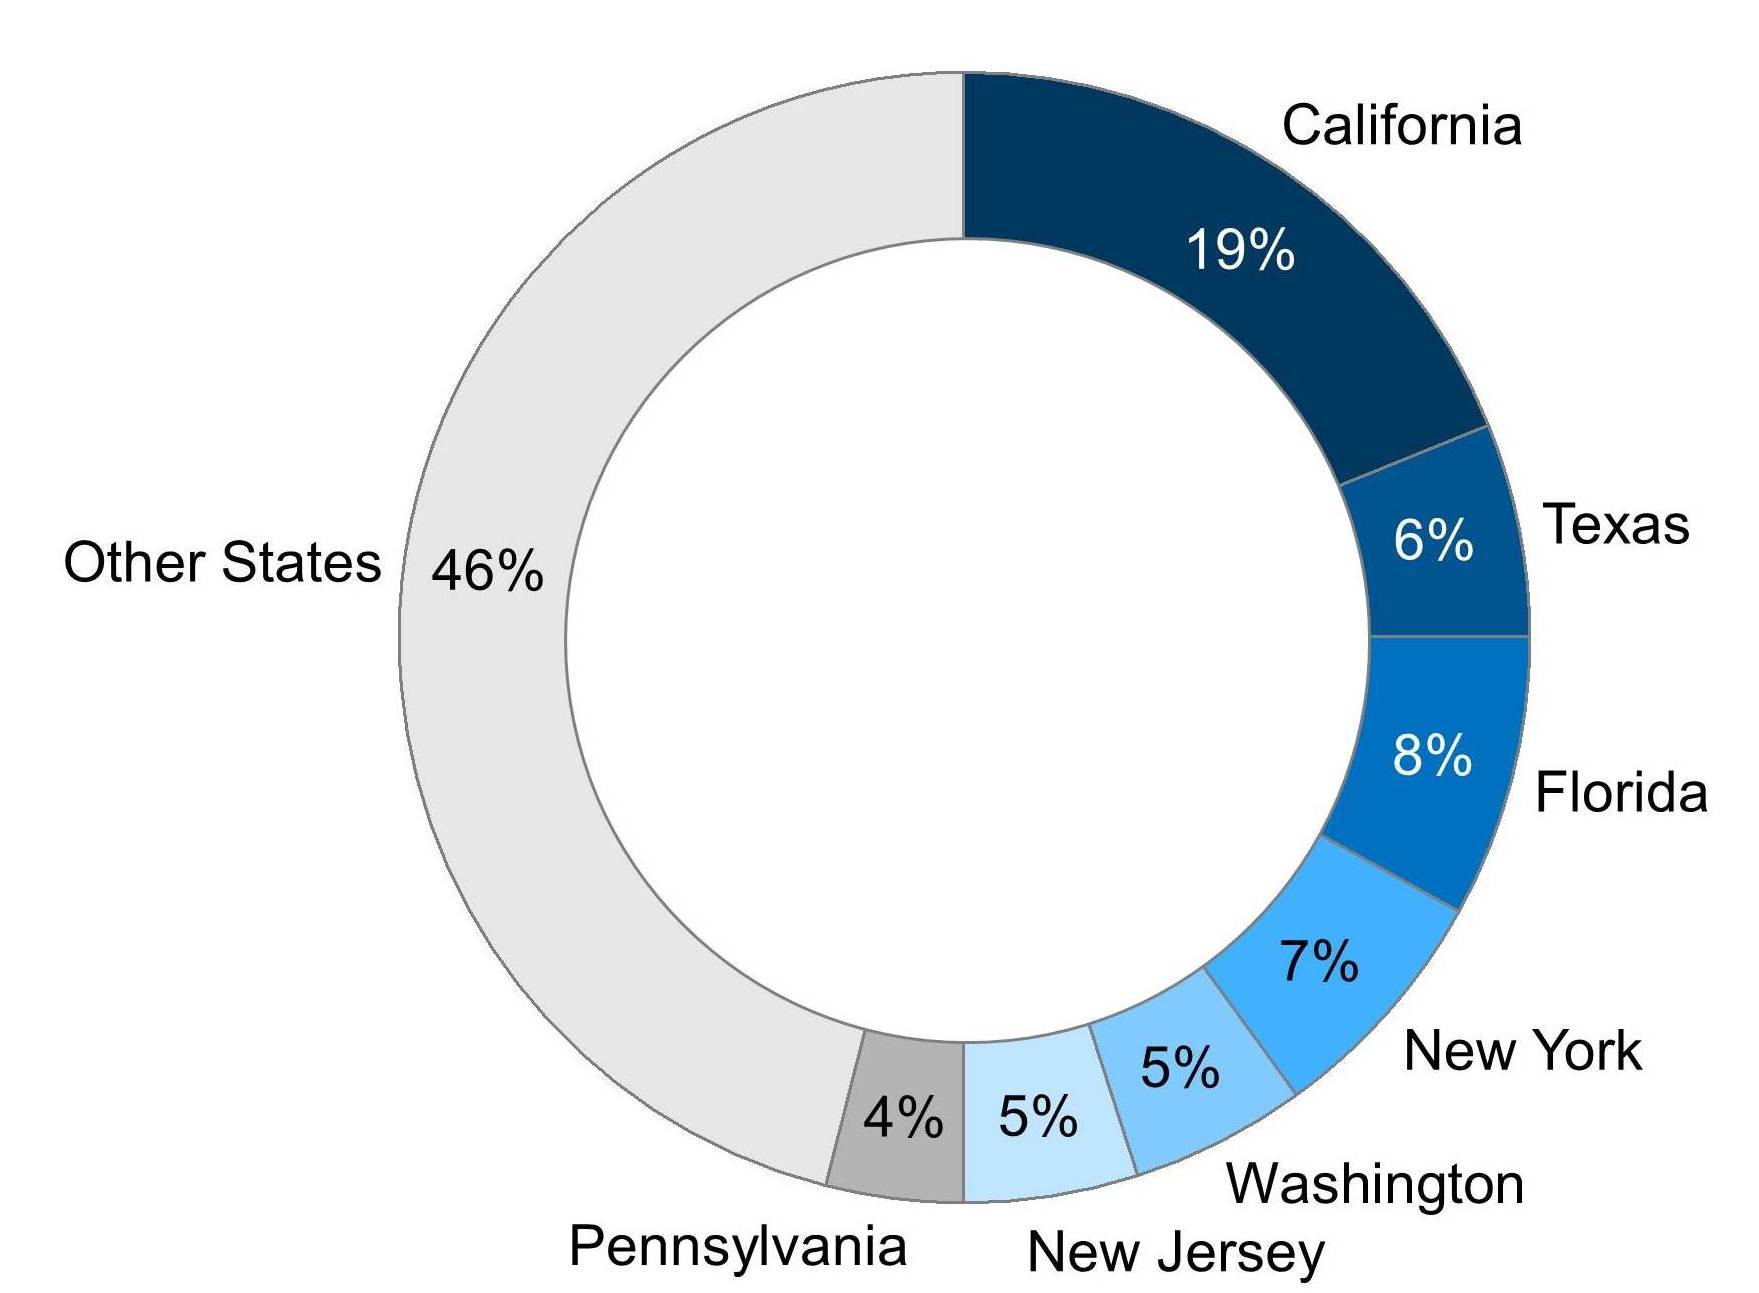
The top 7 states with the most EB-5 regional centers account for 54% of all EB-5 regional centers in the nation. At 19%, the state of California holds the highest number of EB-5 regional centers. Florida, the next highest, holds 8% of all EB-5 regional centers, followed by New York with 7%.
Applications for new EB-5 regional centers have skyrocketed in the past year. Additionally, 2015 saw an 88% increase in the number of approved EB-5 regional centers. However, with new regulatory changes on the horizon for EB-5 regional centers, we may very well see many EB-5 regional centers consolidate and begin to favor renting or affiliating over ownership.
EB-5 Project Concentration
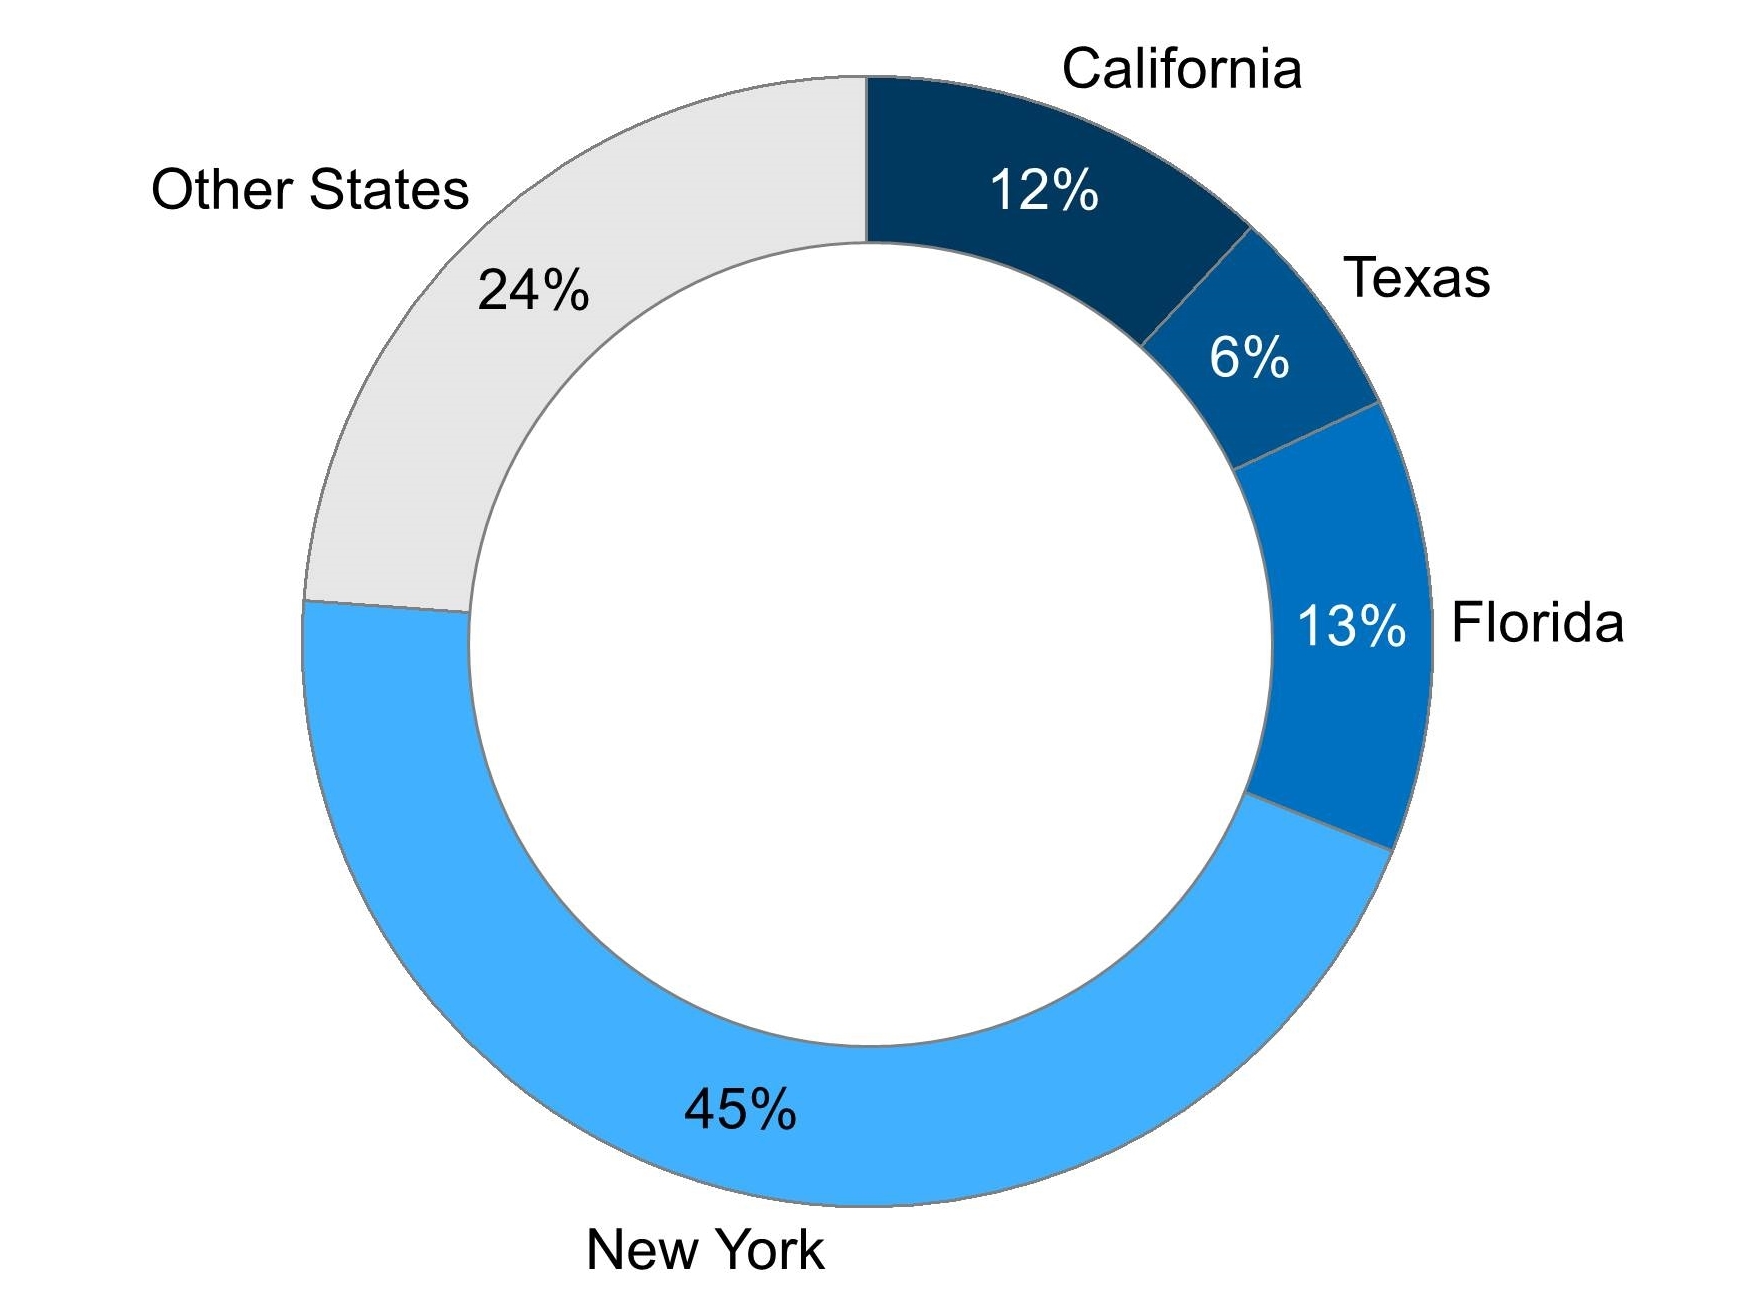
Concentration of Projects by State 2015
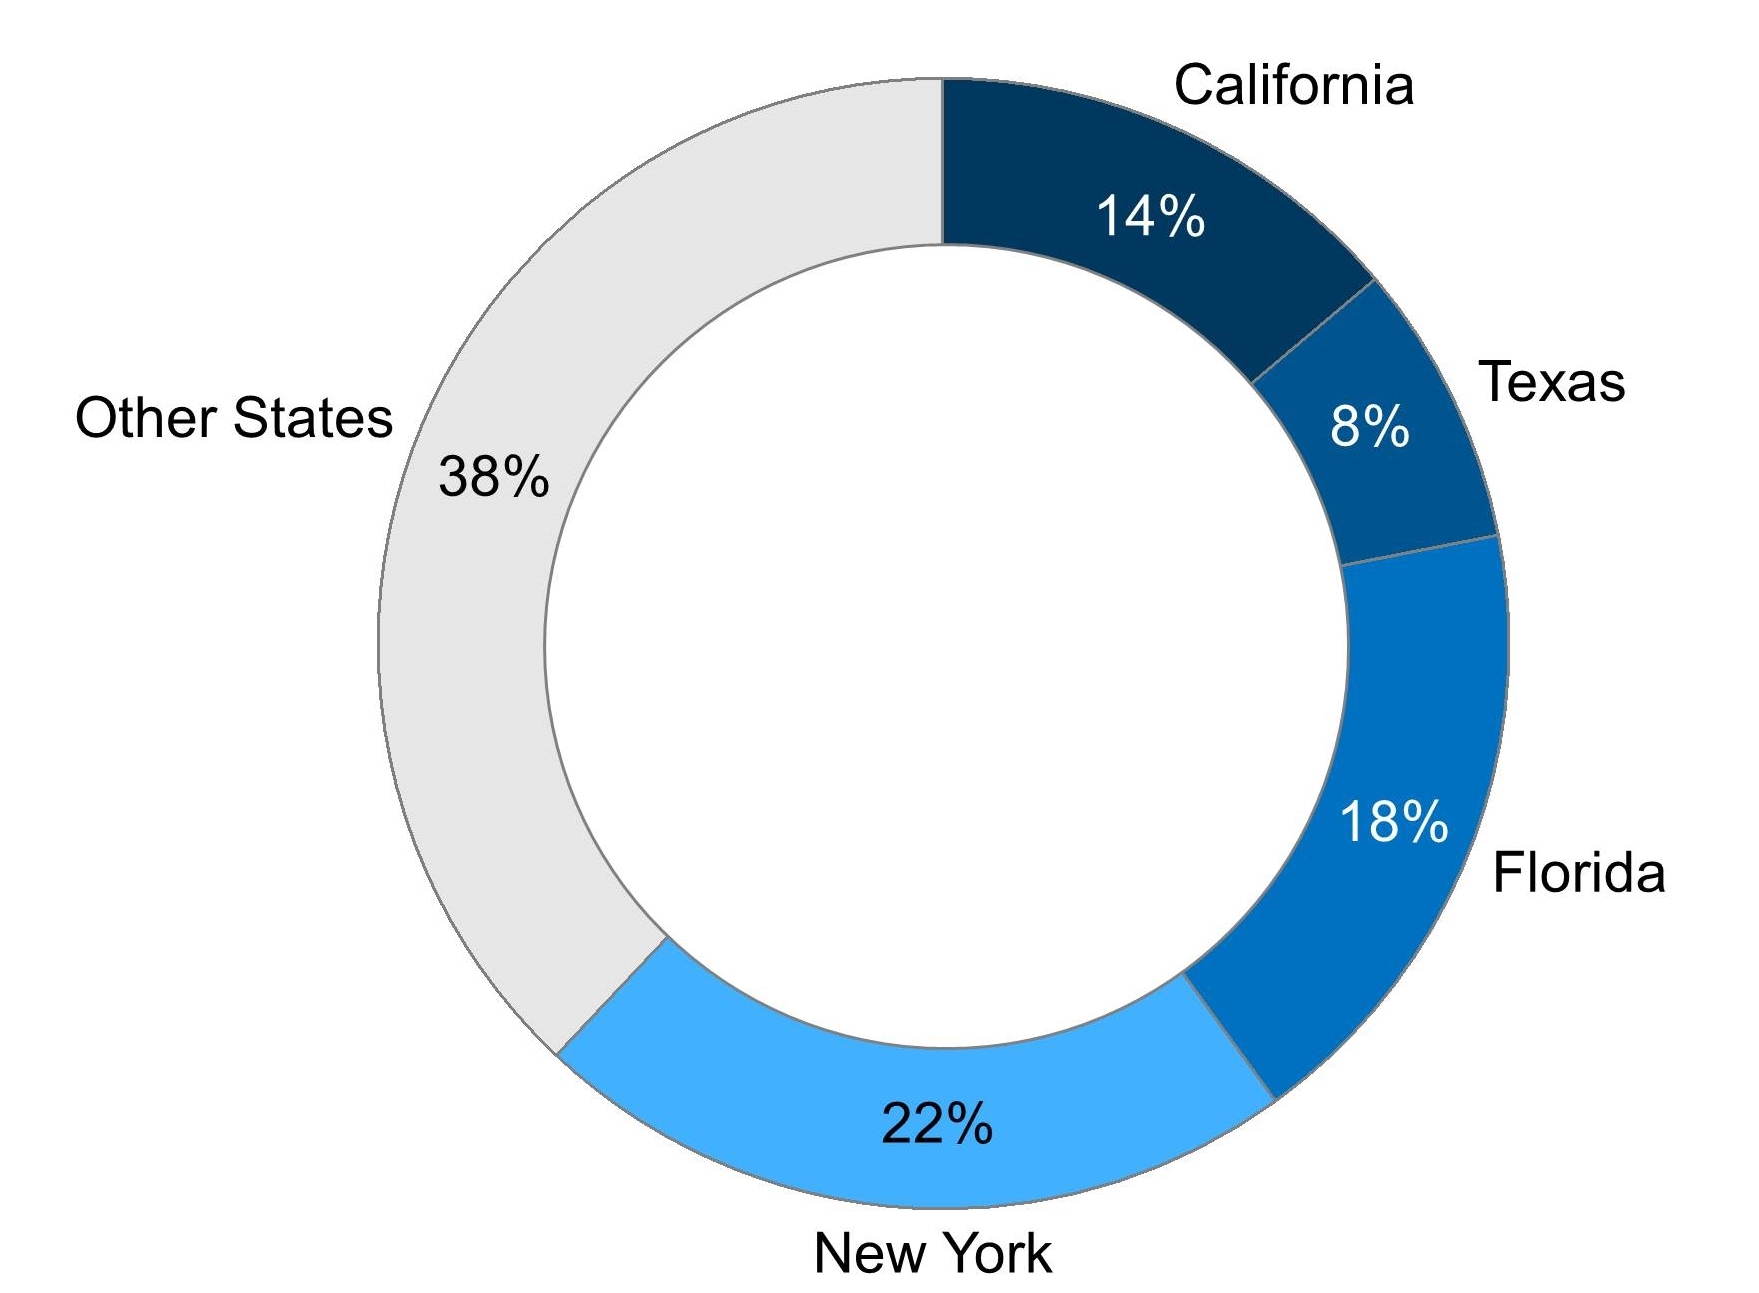
The top 4 states for EB-5 projects are New York, Florida, California, and Texas, which account for 62% of all projects done in the U.S. The state of New York holds a disproportionately large share of projects. While it has only 7% of all regional centers, it accounts for 22% of all projects. On the other hand, only 14% of projects are done in California, even though the state contains 19% of all regional centers.
The top states for EB-5 projects are unsurprising considering how foreign investors show a great preference for desirable and familiar locations for their projects.
Projects by Industry Sector
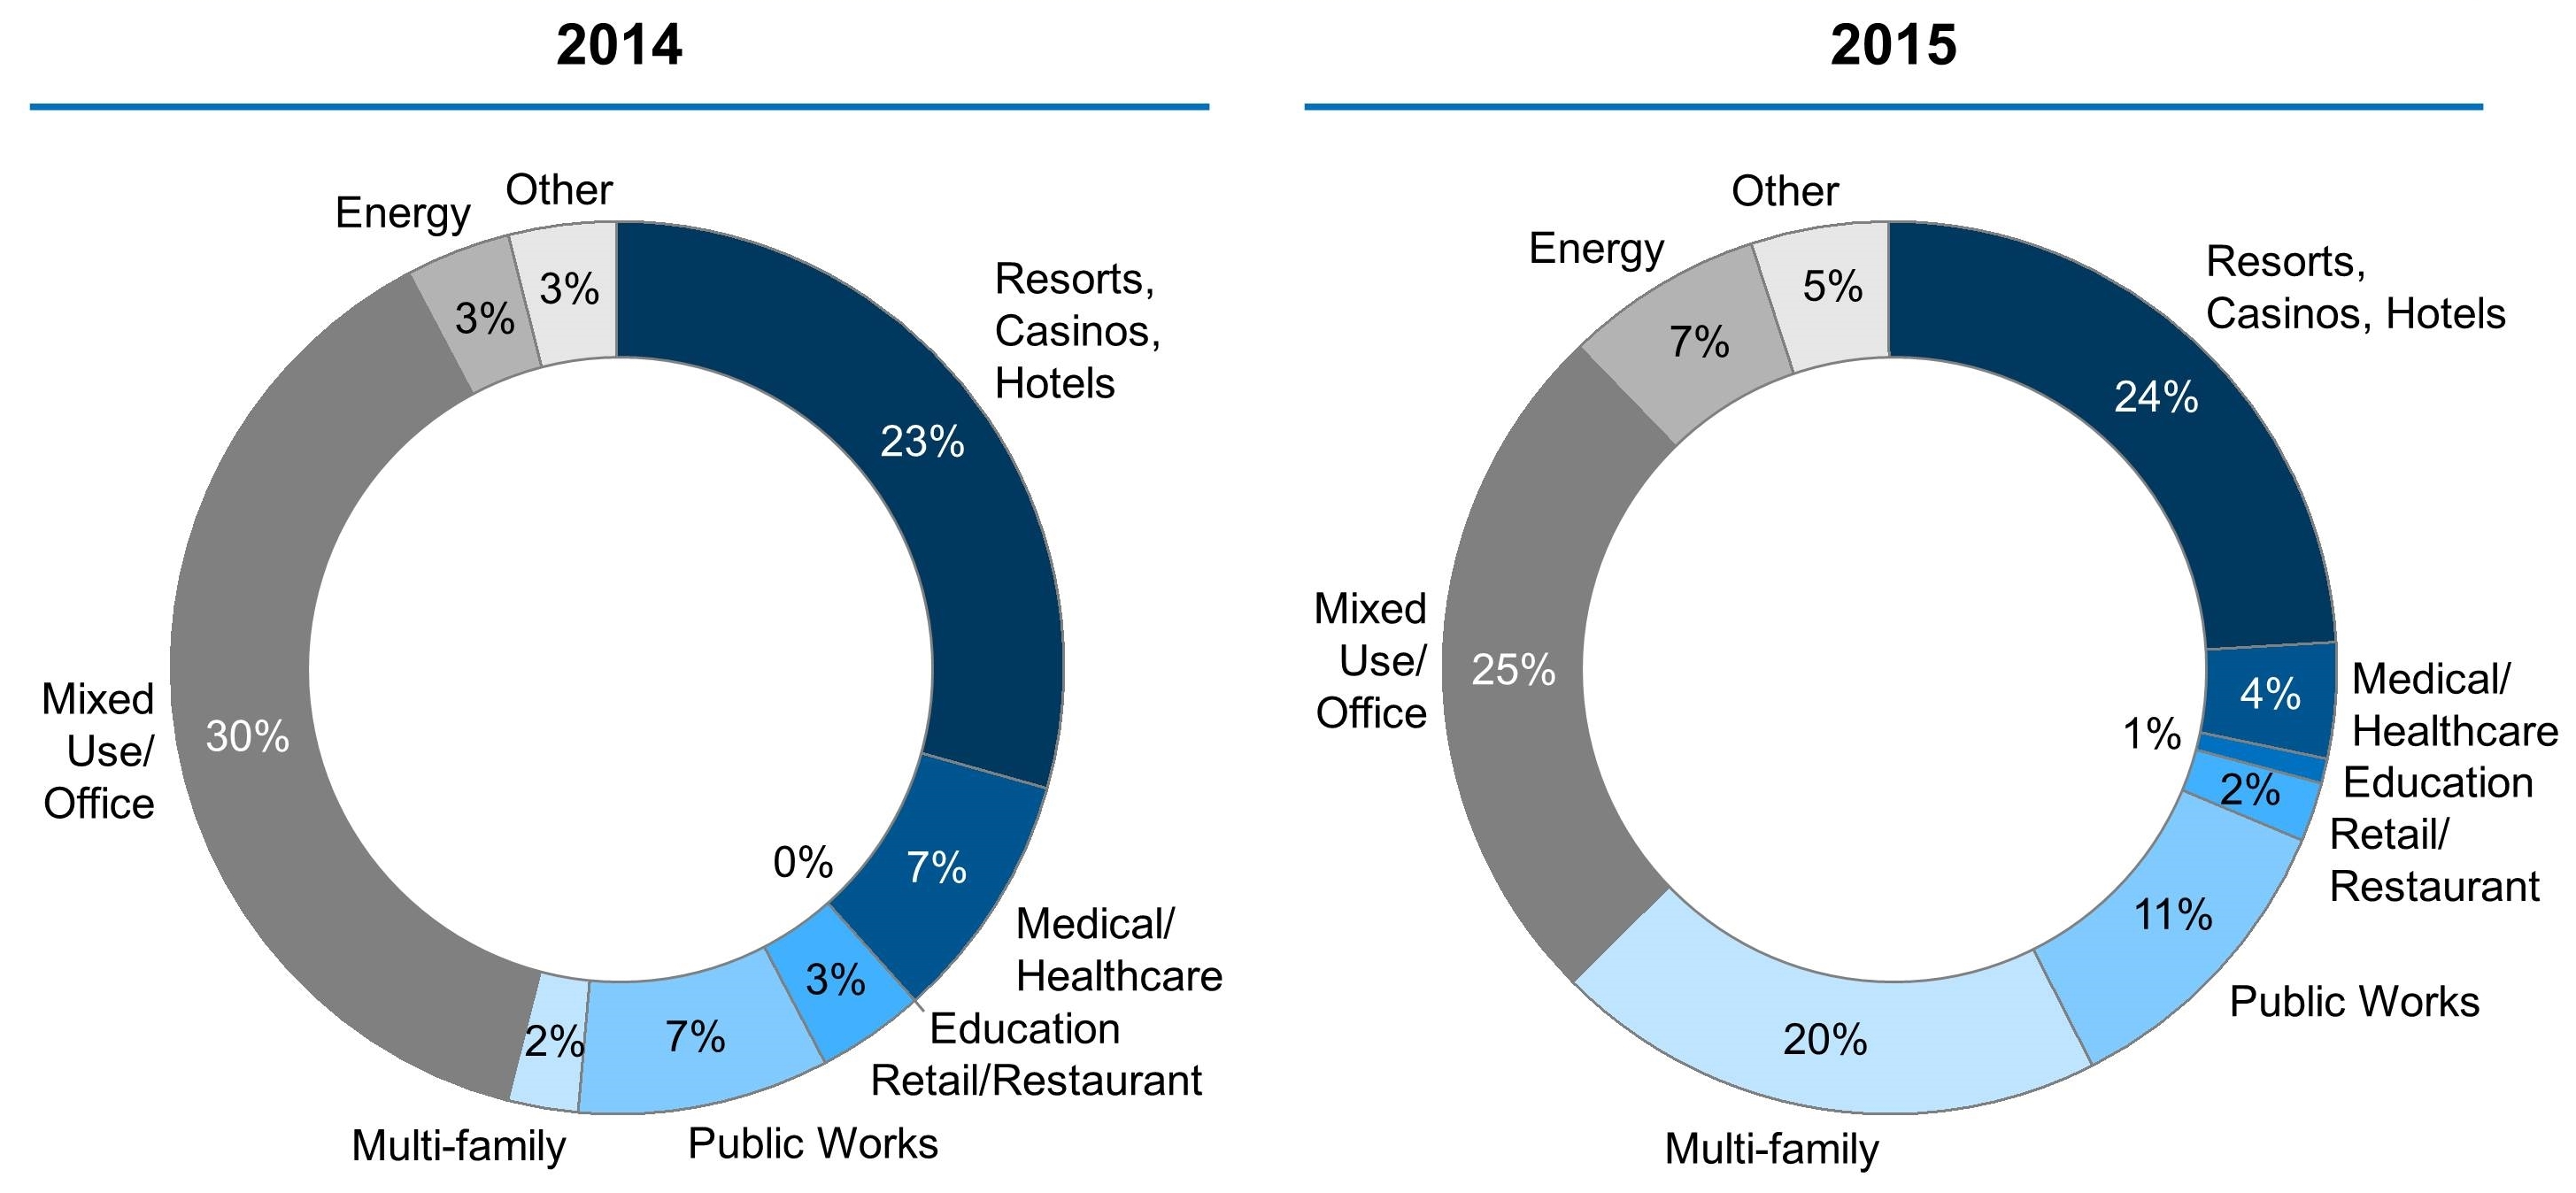
Project Distribution 2014 – 2015
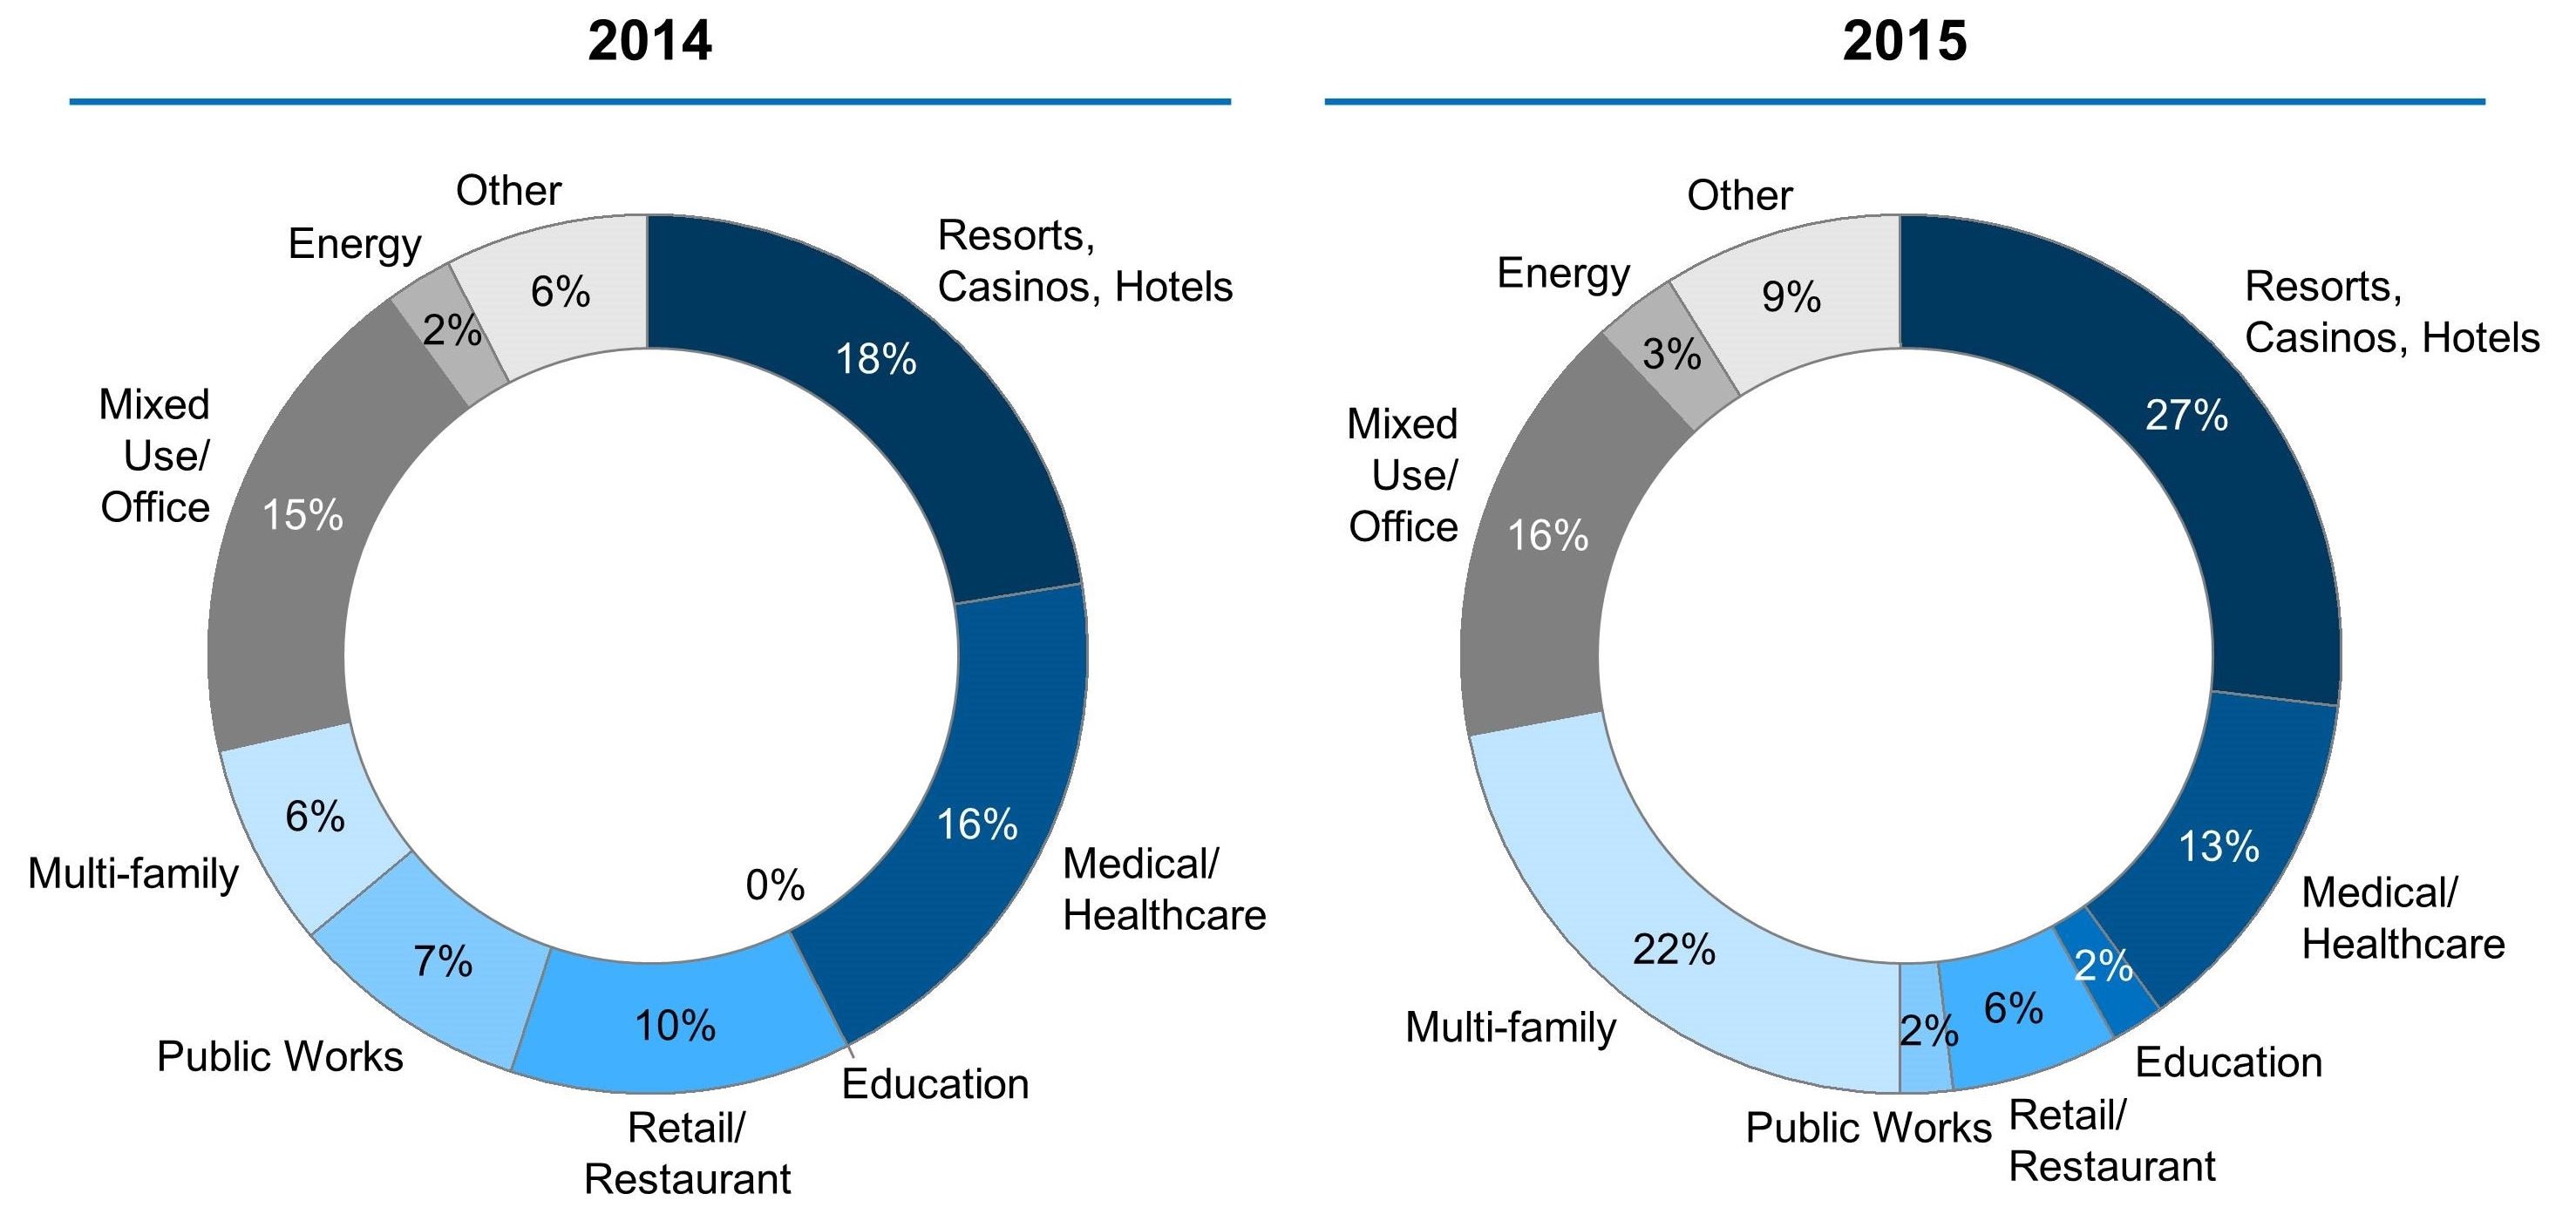
Developers and investors showed more interest in resort, casino, and hotel developments as well as multi-family housing projects in 2015 than they did in 2014. Meanwhile, projects in retail and restaurant developments, public works, and healthcare declined as a percentage of overall project distribution. Energy and mixed-use office space stayed relatively constant.
Multi-family housing projects in particular saw a significant rise from just 6% of total projects in 2014 to 22% in 2015.
Distribution of EB-5 Capital by Industry Sector
Target Raise Distribution 2014 – 2015
In 2015, EB-5 capital poured into multi-family housing projects, resorts and casinos, and mixed-use office space, which together accounted for 69% of all capital raised. Public works and energy accounted for another 18% of capital raised in 2015. However, when compared to 2014, there was a retraction in funding toward mixed-use office space, healthcare, as well as retail and restaurant developments.
In 2015, funding toward multi-family housing projects ballooned, which is reflected in the change of multi-family projects accounting for only 2% of projects in 2014 to 22% in 2015.
Size of Projects and Distribution in 2015
2015 Size of Target Raise
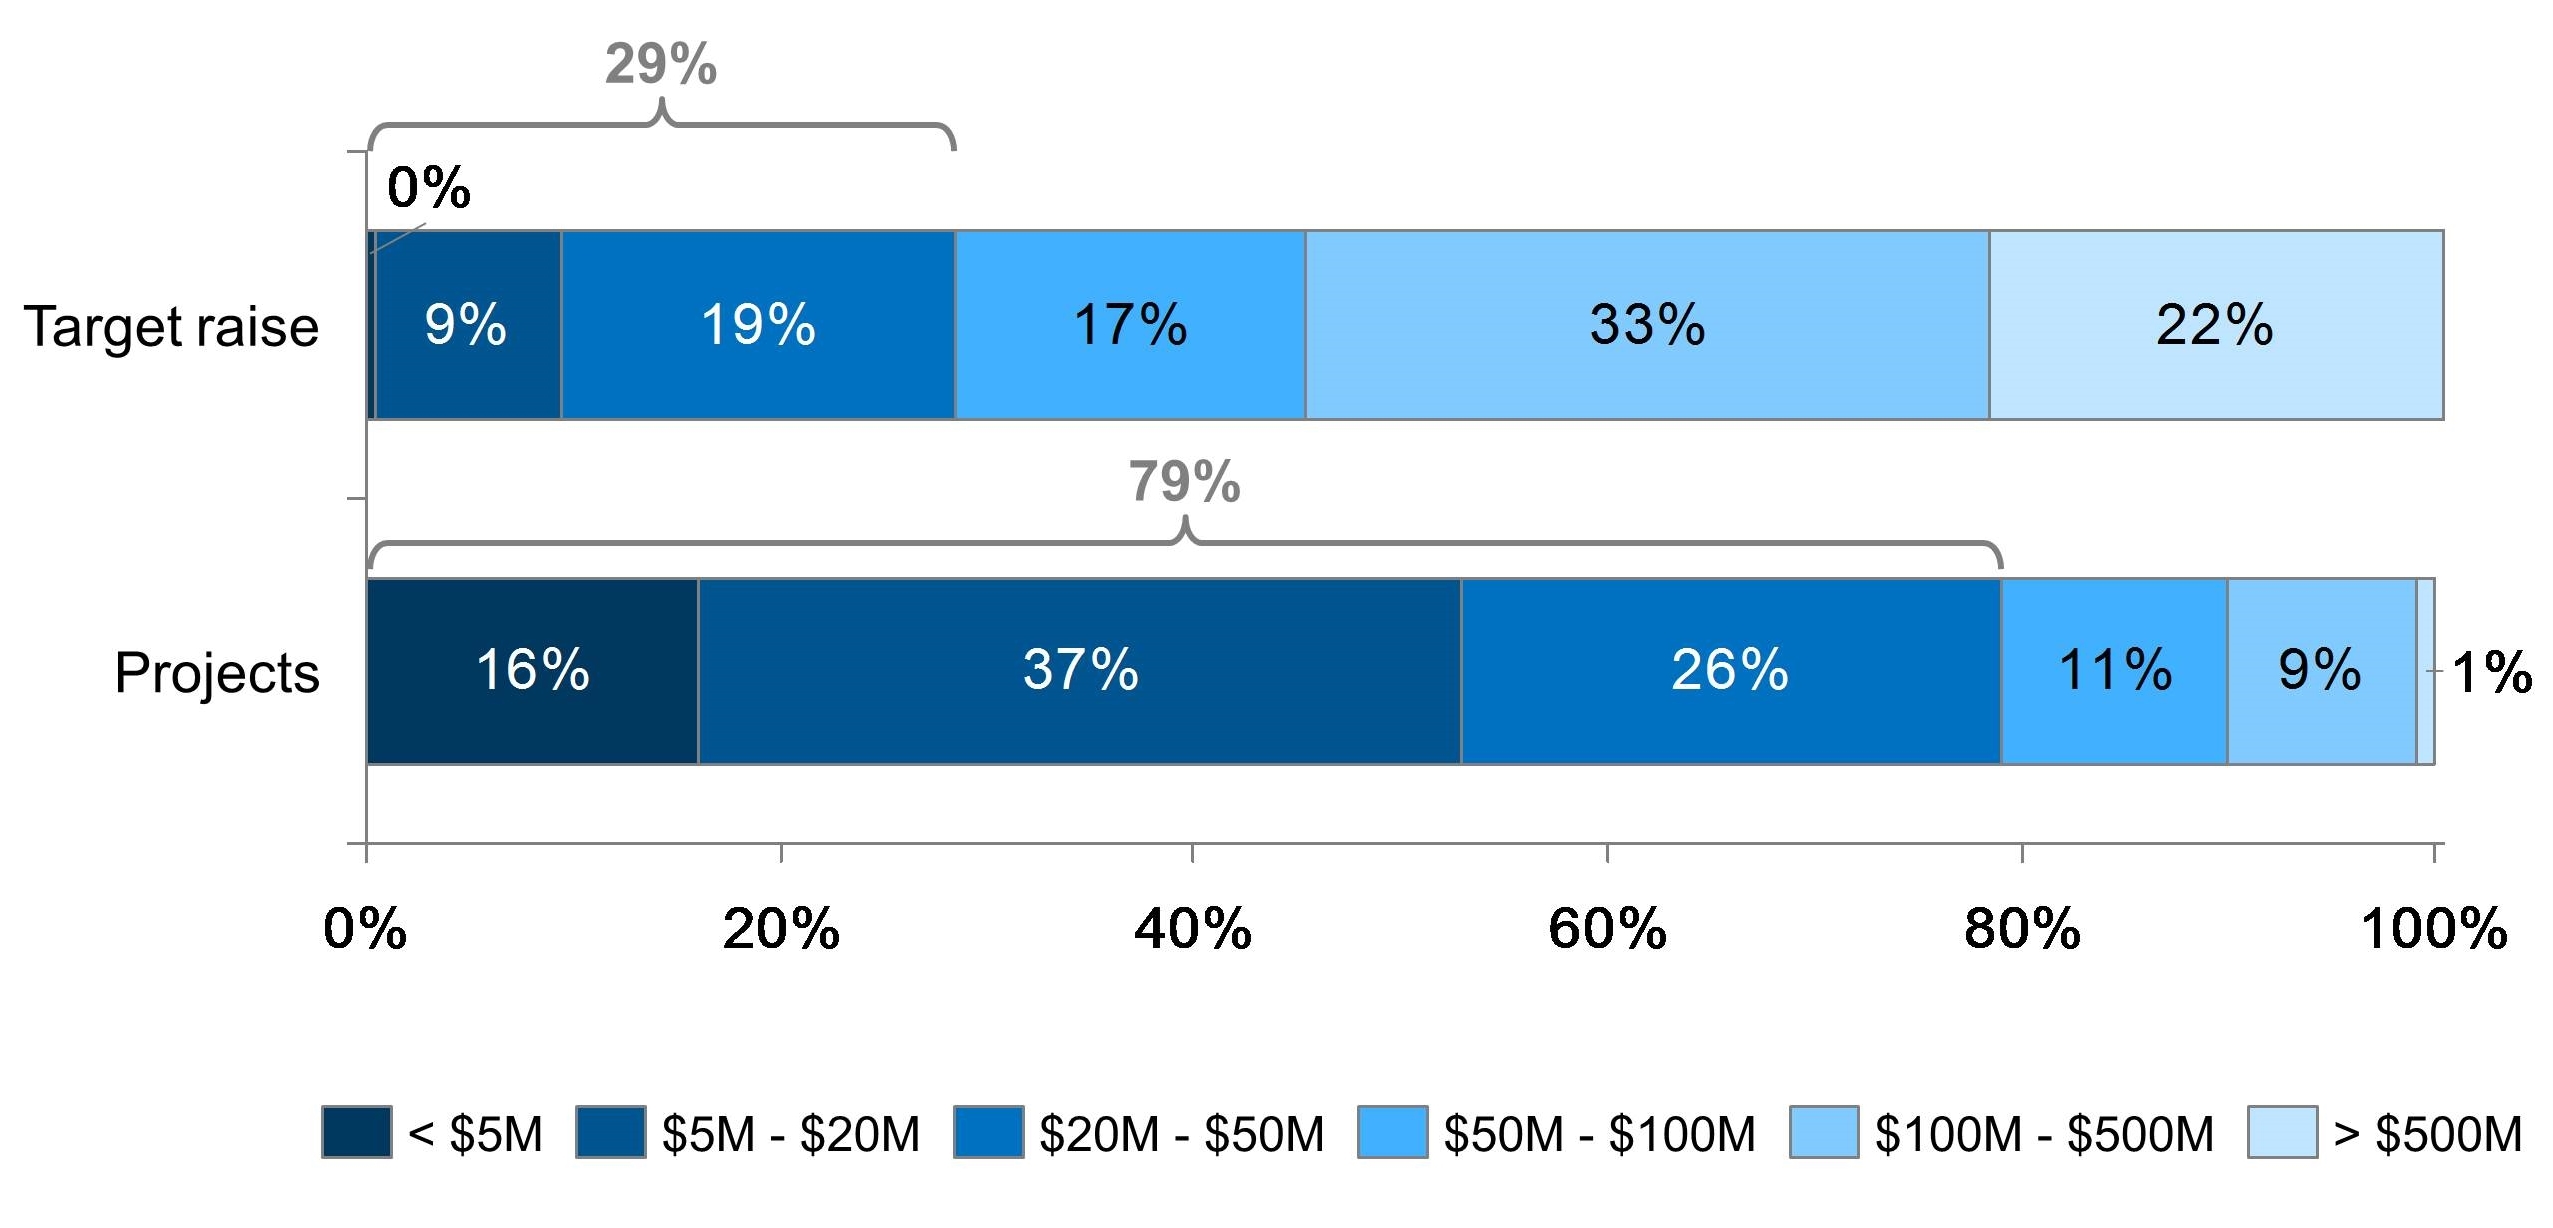
Very few projects ultimately raise their target fundraising amount. In 2015, 22% of projects sought to raise more than $500M in funding, but only 1% of those projects actually hit their target amount. Of the 33% of projects that sought to raise between $100M and $500M, only 9% achieved their goal.
Conversely, only 9% of projects aimed to raise between $5M and $20M, but 37% of projects ultimately end up raising that amount. Fewer than 1% of projects set their target fundraising at less than $5M, but 16% of projects ultimately get funded in that amount. In fact, 63% of all projects raise somewhere between $5M and $50M. While most investors set their target fundraising goals high, very few ultimately achieve those goals.
Historical Trends in Project Size
Size of Target Raise, 2011 – 2015
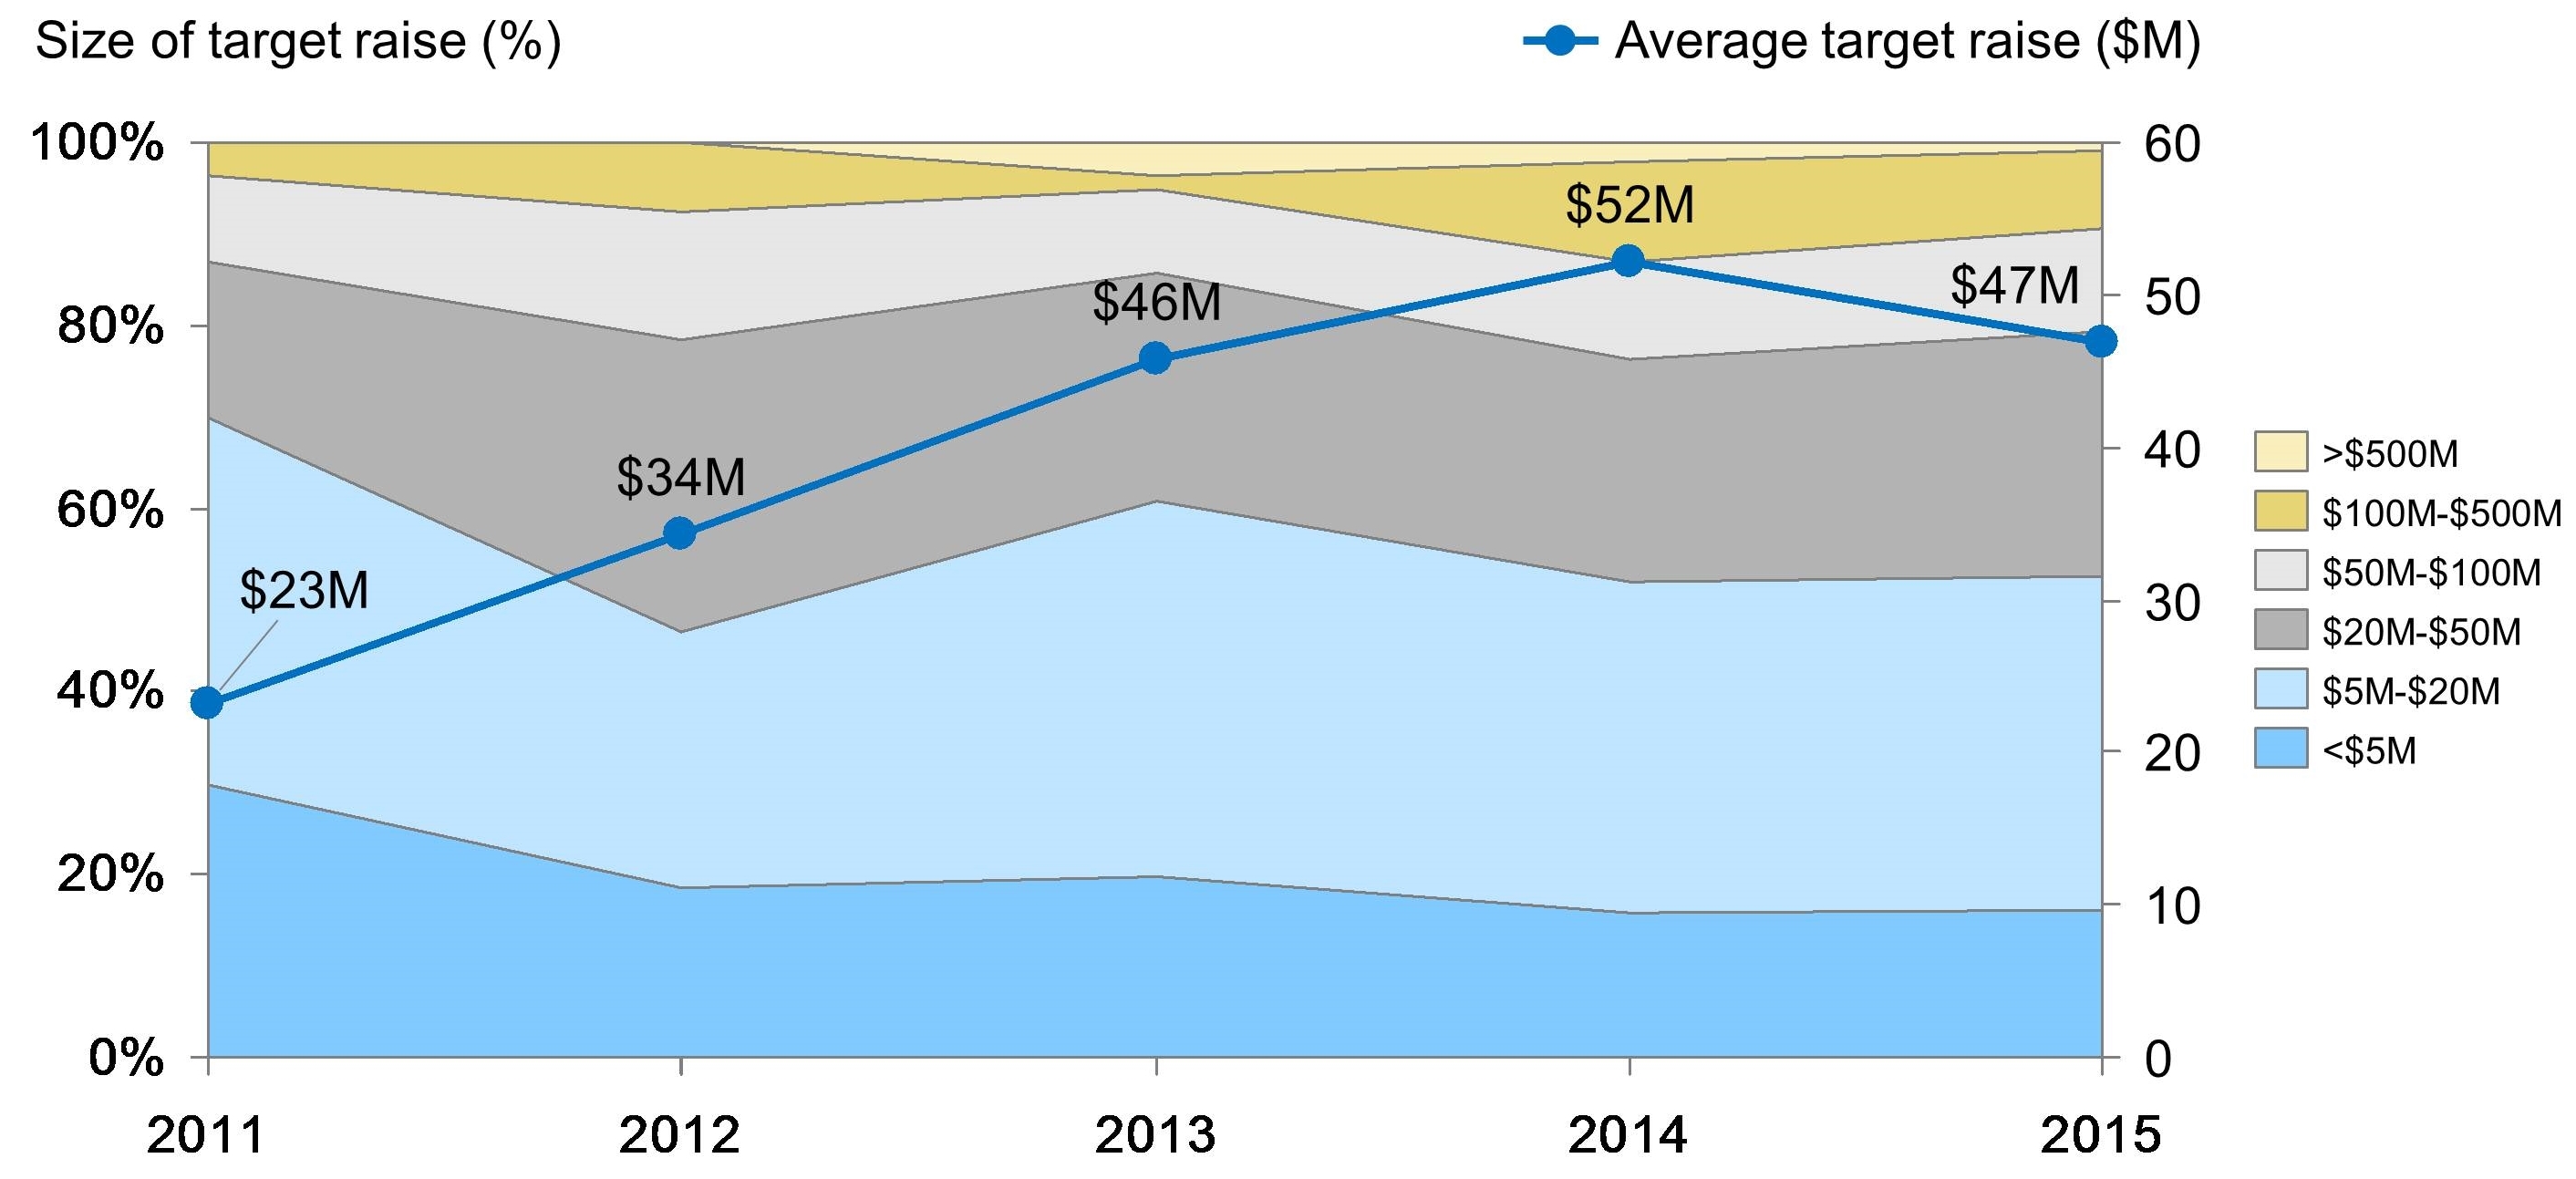
Since 2011, the average target raise has gone up consistently by approximately 30% every year. In 2015, however, for the first time in 5 years, investors set lower expectations for their fundraising goals. This change is mainly attributed to fewer investors raising money for projects in the $100M–$500M and >$500M range.
Overall Summary by State in 2015
Overall Summary by State in 2015
When it comes to EB-5 projects, 4 states are the most relevant: New York, California, Florida, and Texas. Located within these 4 states are 62% of all projects, 75% of all target raise, and 40% of all regional centers.
Funding Model 2015
2015 Funding Structure
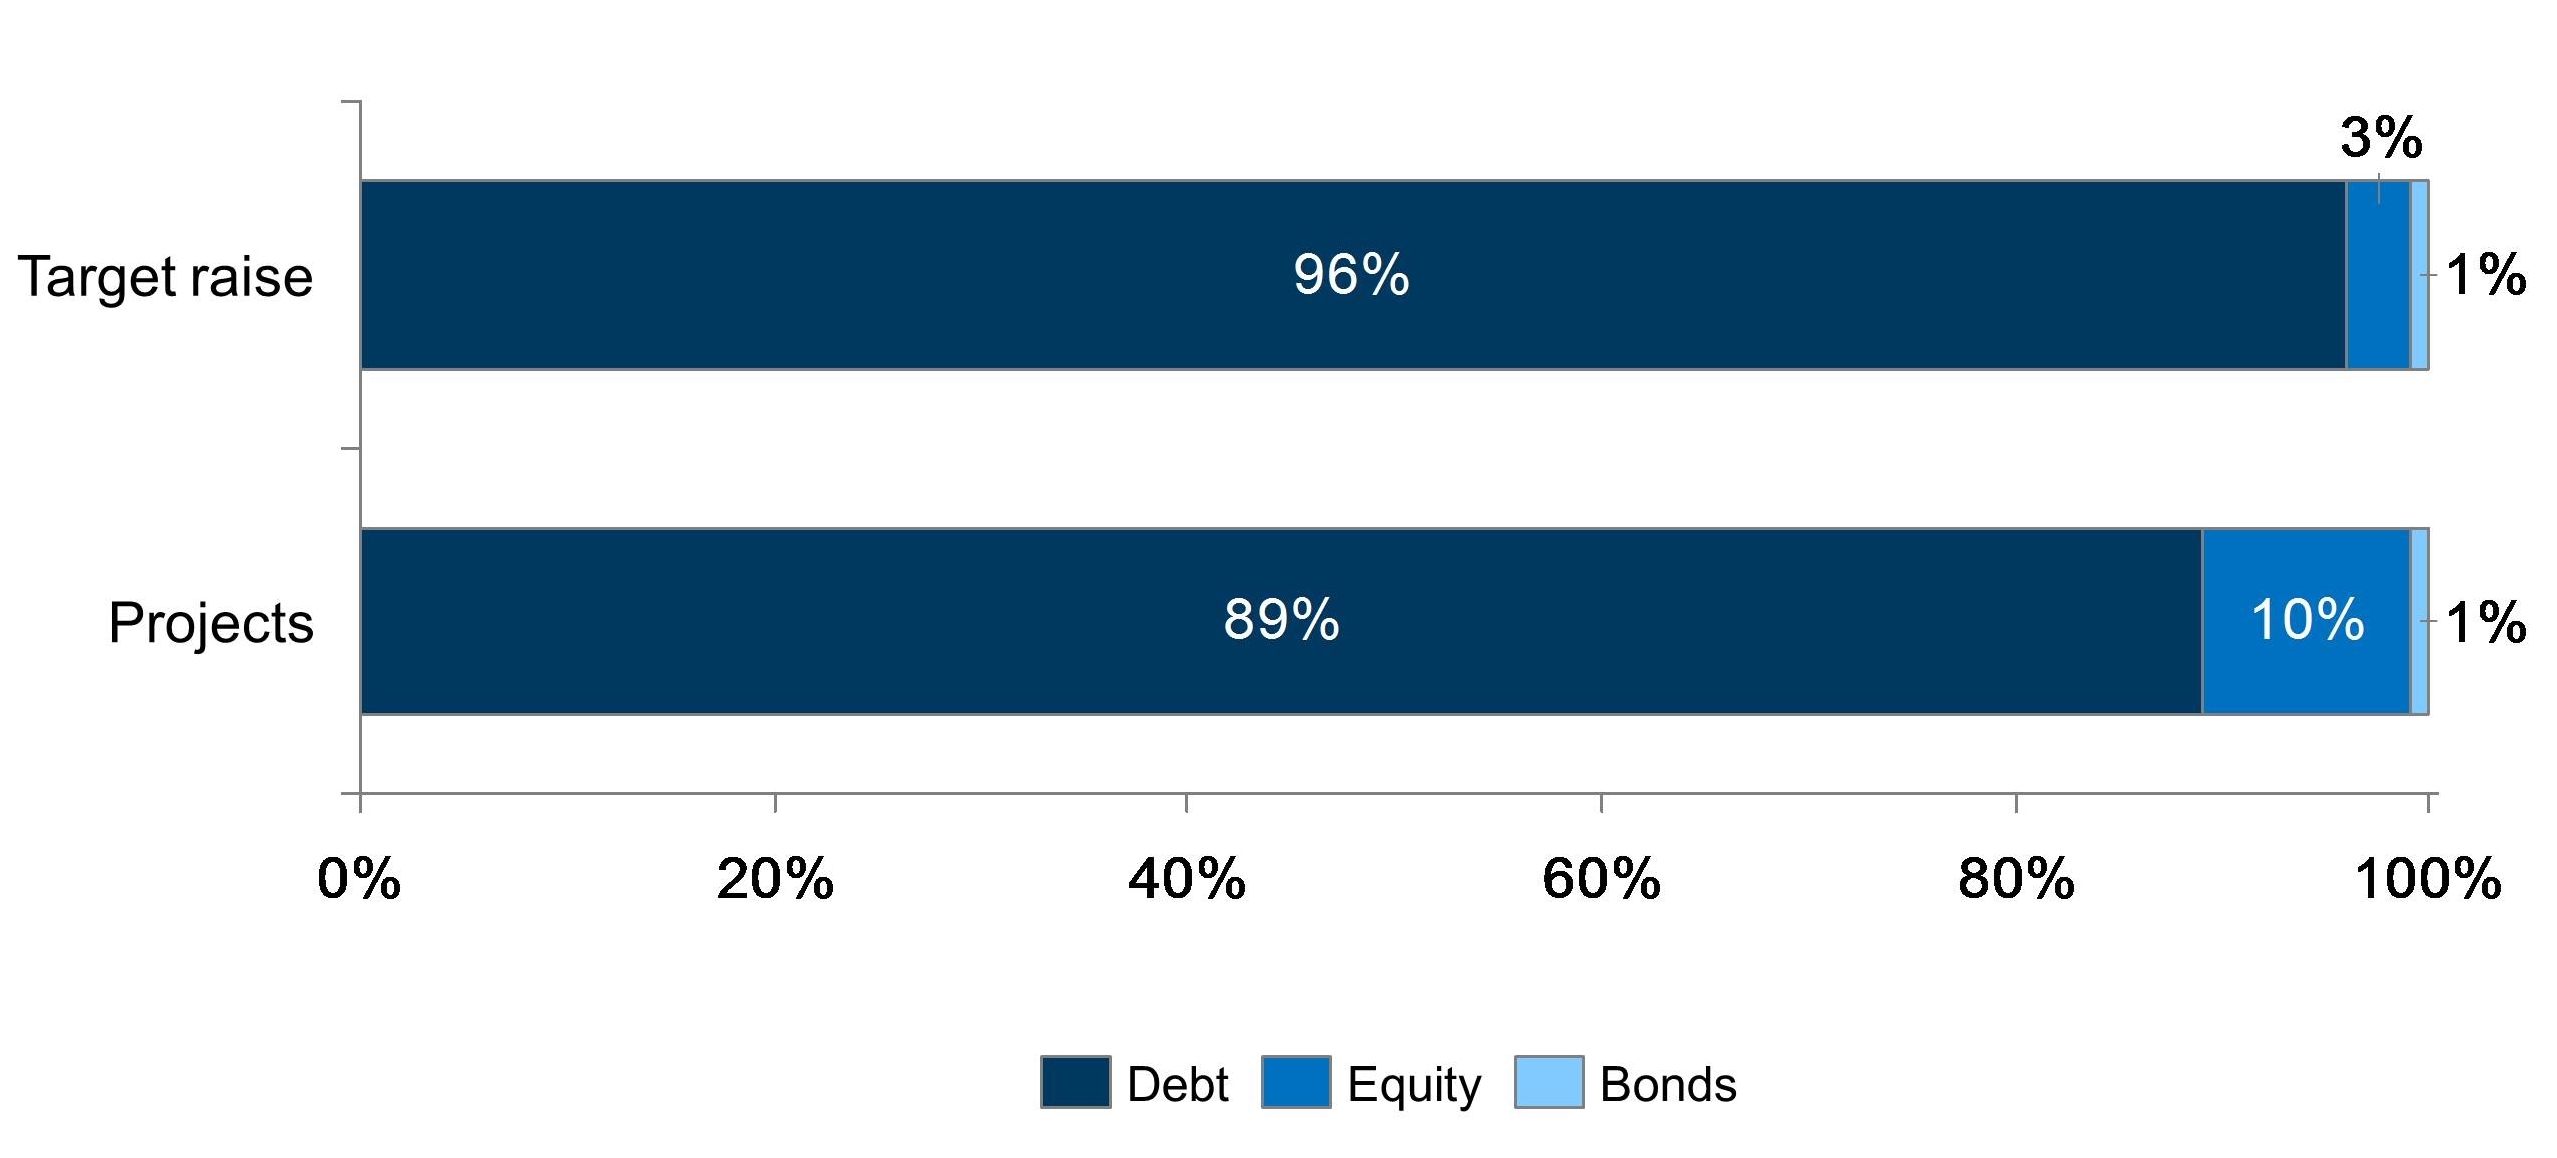
EB-5 project developers are often having to put more equity and less debt in their projects than they initially hoped in their target raise. In 2015, the average funding structure for target raises was roughly 94% debt, 5% equity, and 1% bonds. In reality, however, most projects do not achieve this funding structure. Typically, projects see roughly 87% debt, 12% equity, and 1% bonds. With competition for investment dollars rising, many foreign investors favor projects in which developers have more equity.
Debt Financing Structure – Interest Rates
Debt Financing Structure – Interest Rates
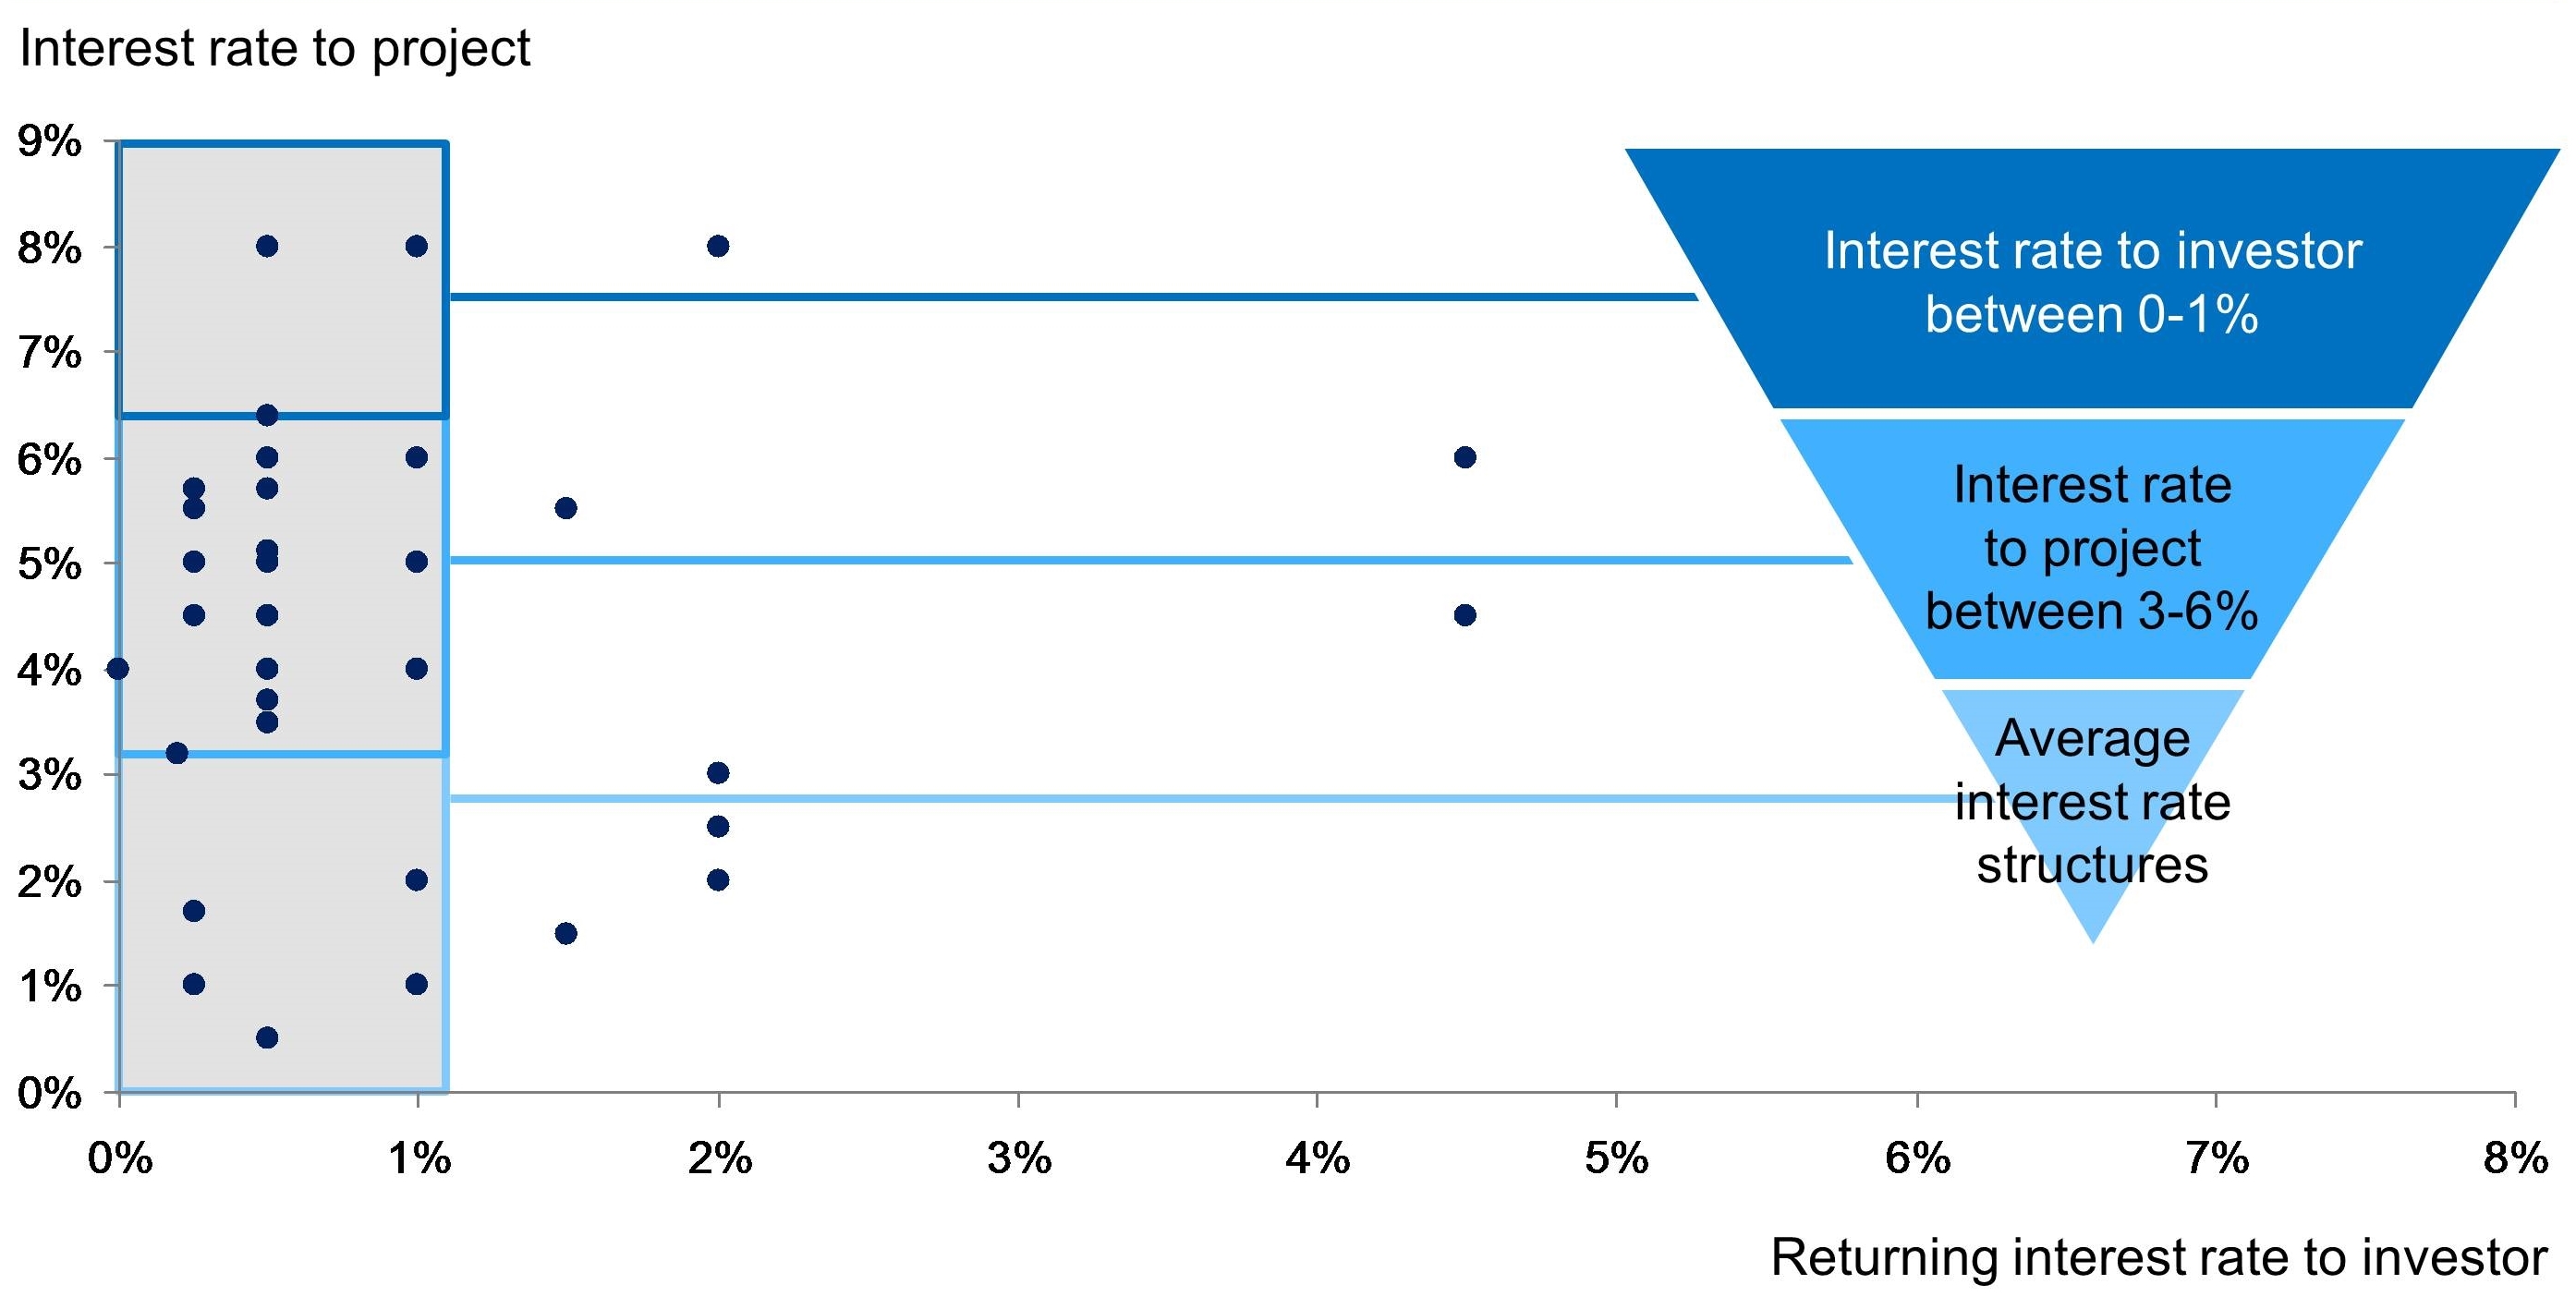
For most projects across the wide gamut of industries—from resorts to manufacturing—loans are being made out to project developers at a rate of between 3% and 6%. A few projects are able to secure interest rates of 1%–3%. Very few projects are receiving interest rates above 6%. Most projects seem to promise a 0%–1% interest rate to the investor, but some are promising up to 2%. Competition for foreign investment may continue to push developers to increase the interest rates made to investors.
Growth Trends in Investor Markets 2014 vs 2015
Growth Trends in Investor Markets 2014 vs 2015
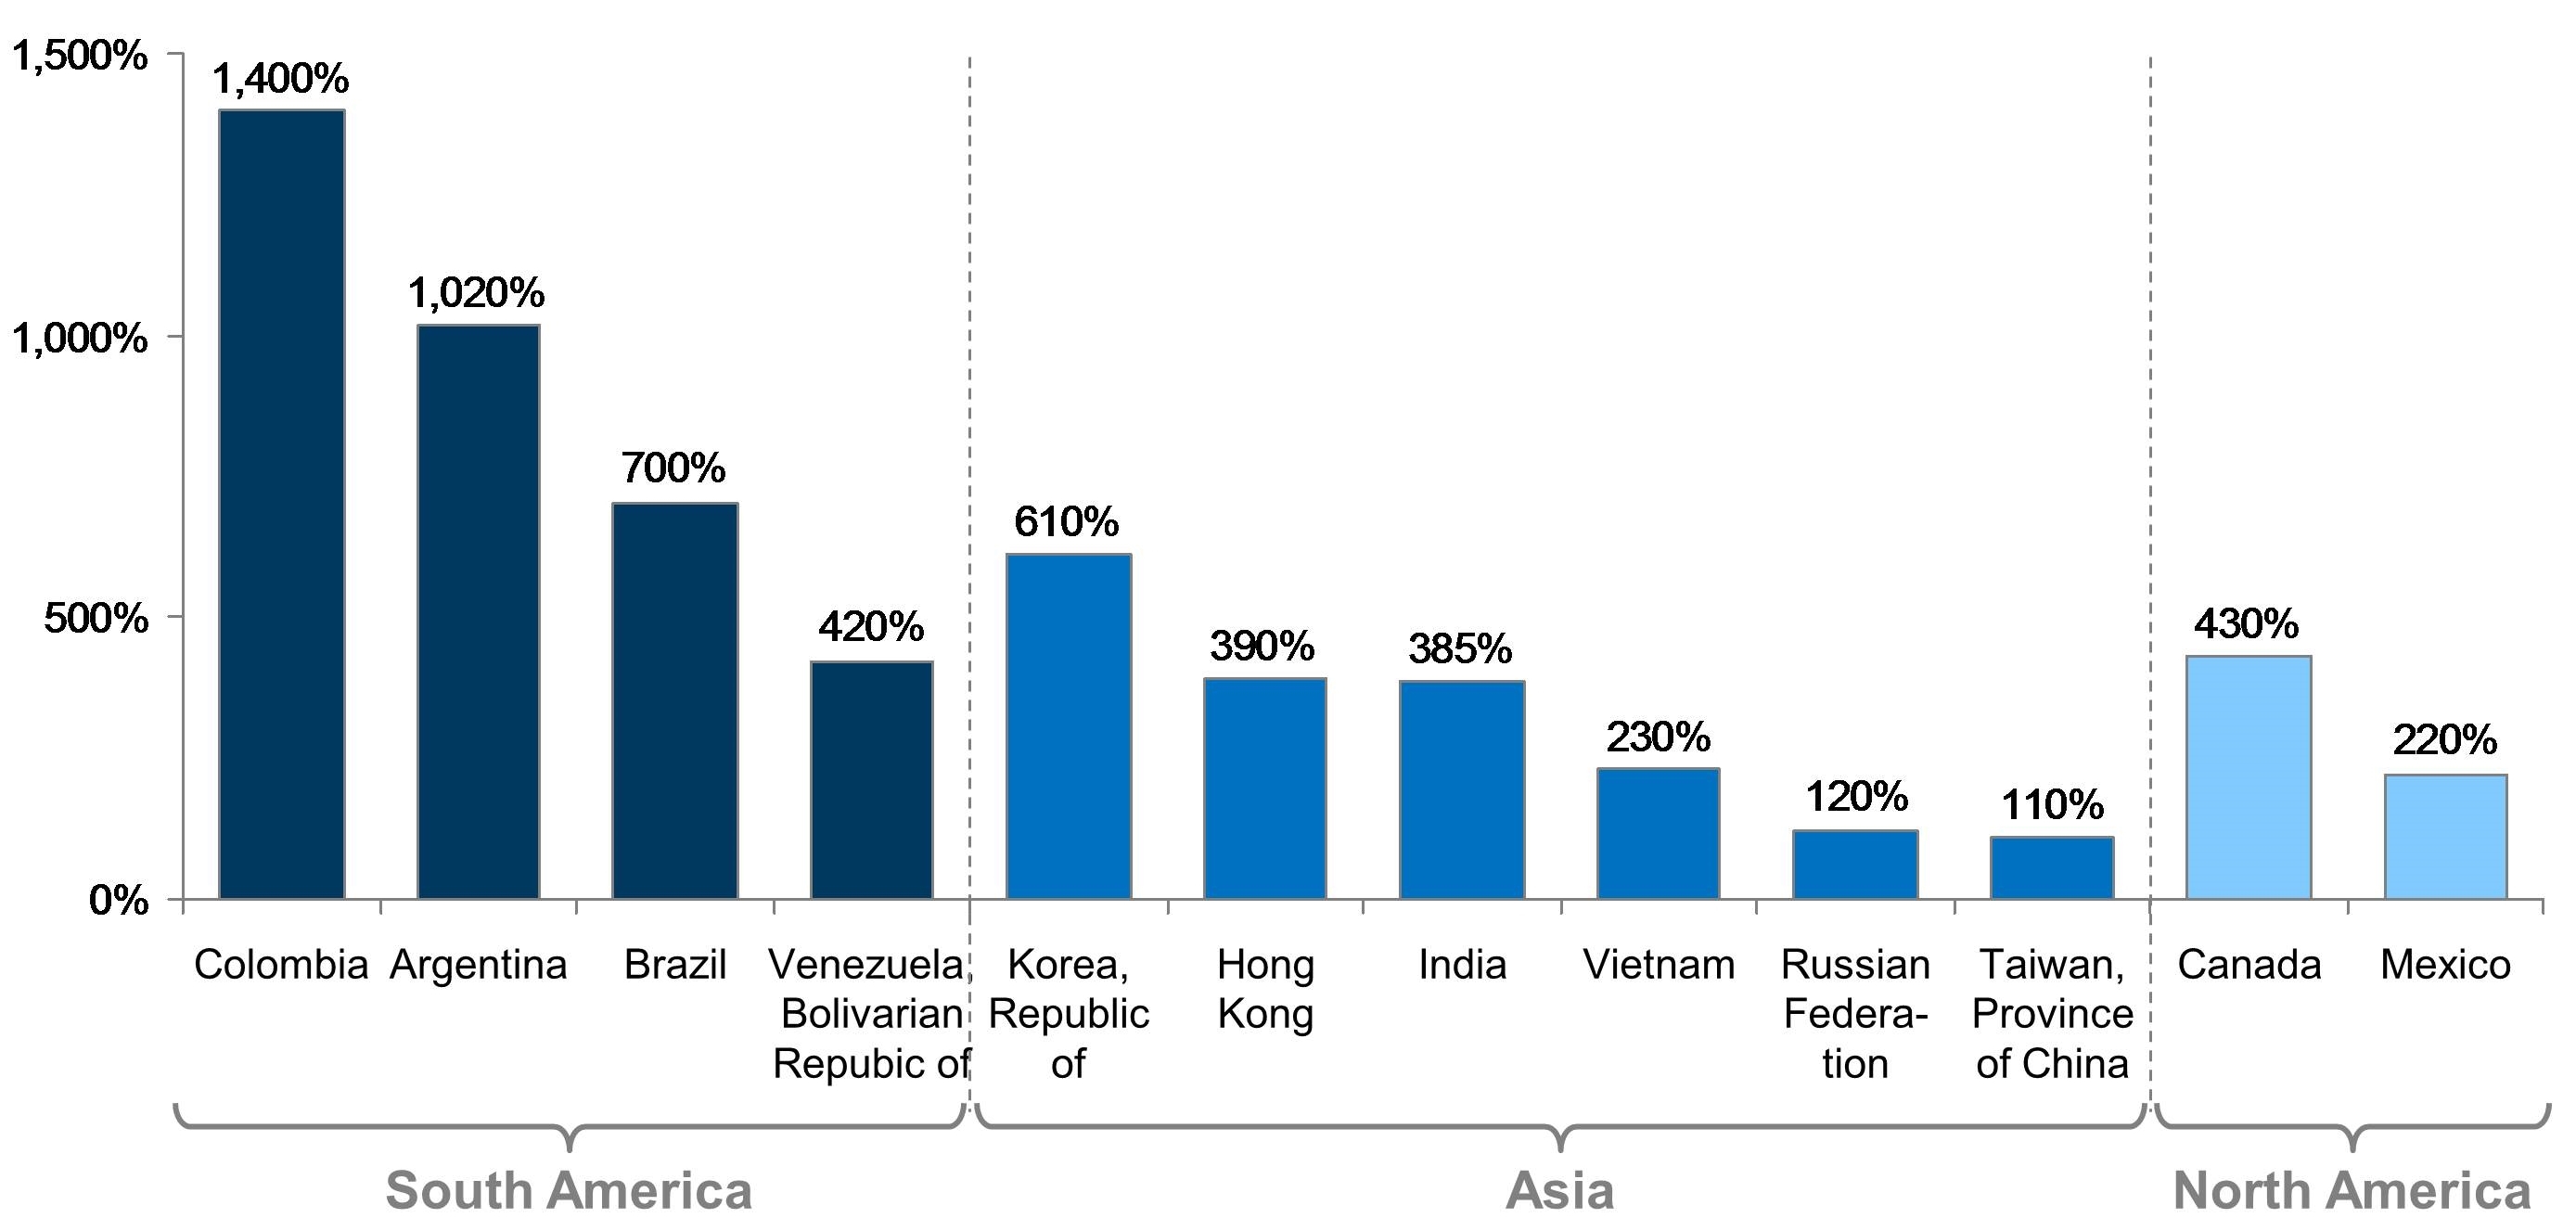
The year 2015 saw the incredible rise of South America, particularly Columbia, Argentina, Brazil, and Venezuela, as a new source of EB-5 investors. Columbia, for example, experienced close to a 1300% rise in new investors, due in part to its small sample size. Asian countries like South Korea, Hong Kong, India, Vietnam, Russia, and Taiwan all saw large growth rates as well, with South Korea achieving 600% growth since 2014. In North America, both Canada and Mexico are emerging as new markets for foreign investment.
Early Release Escrow, the New Norm
Early Release Escrow, the New Norm
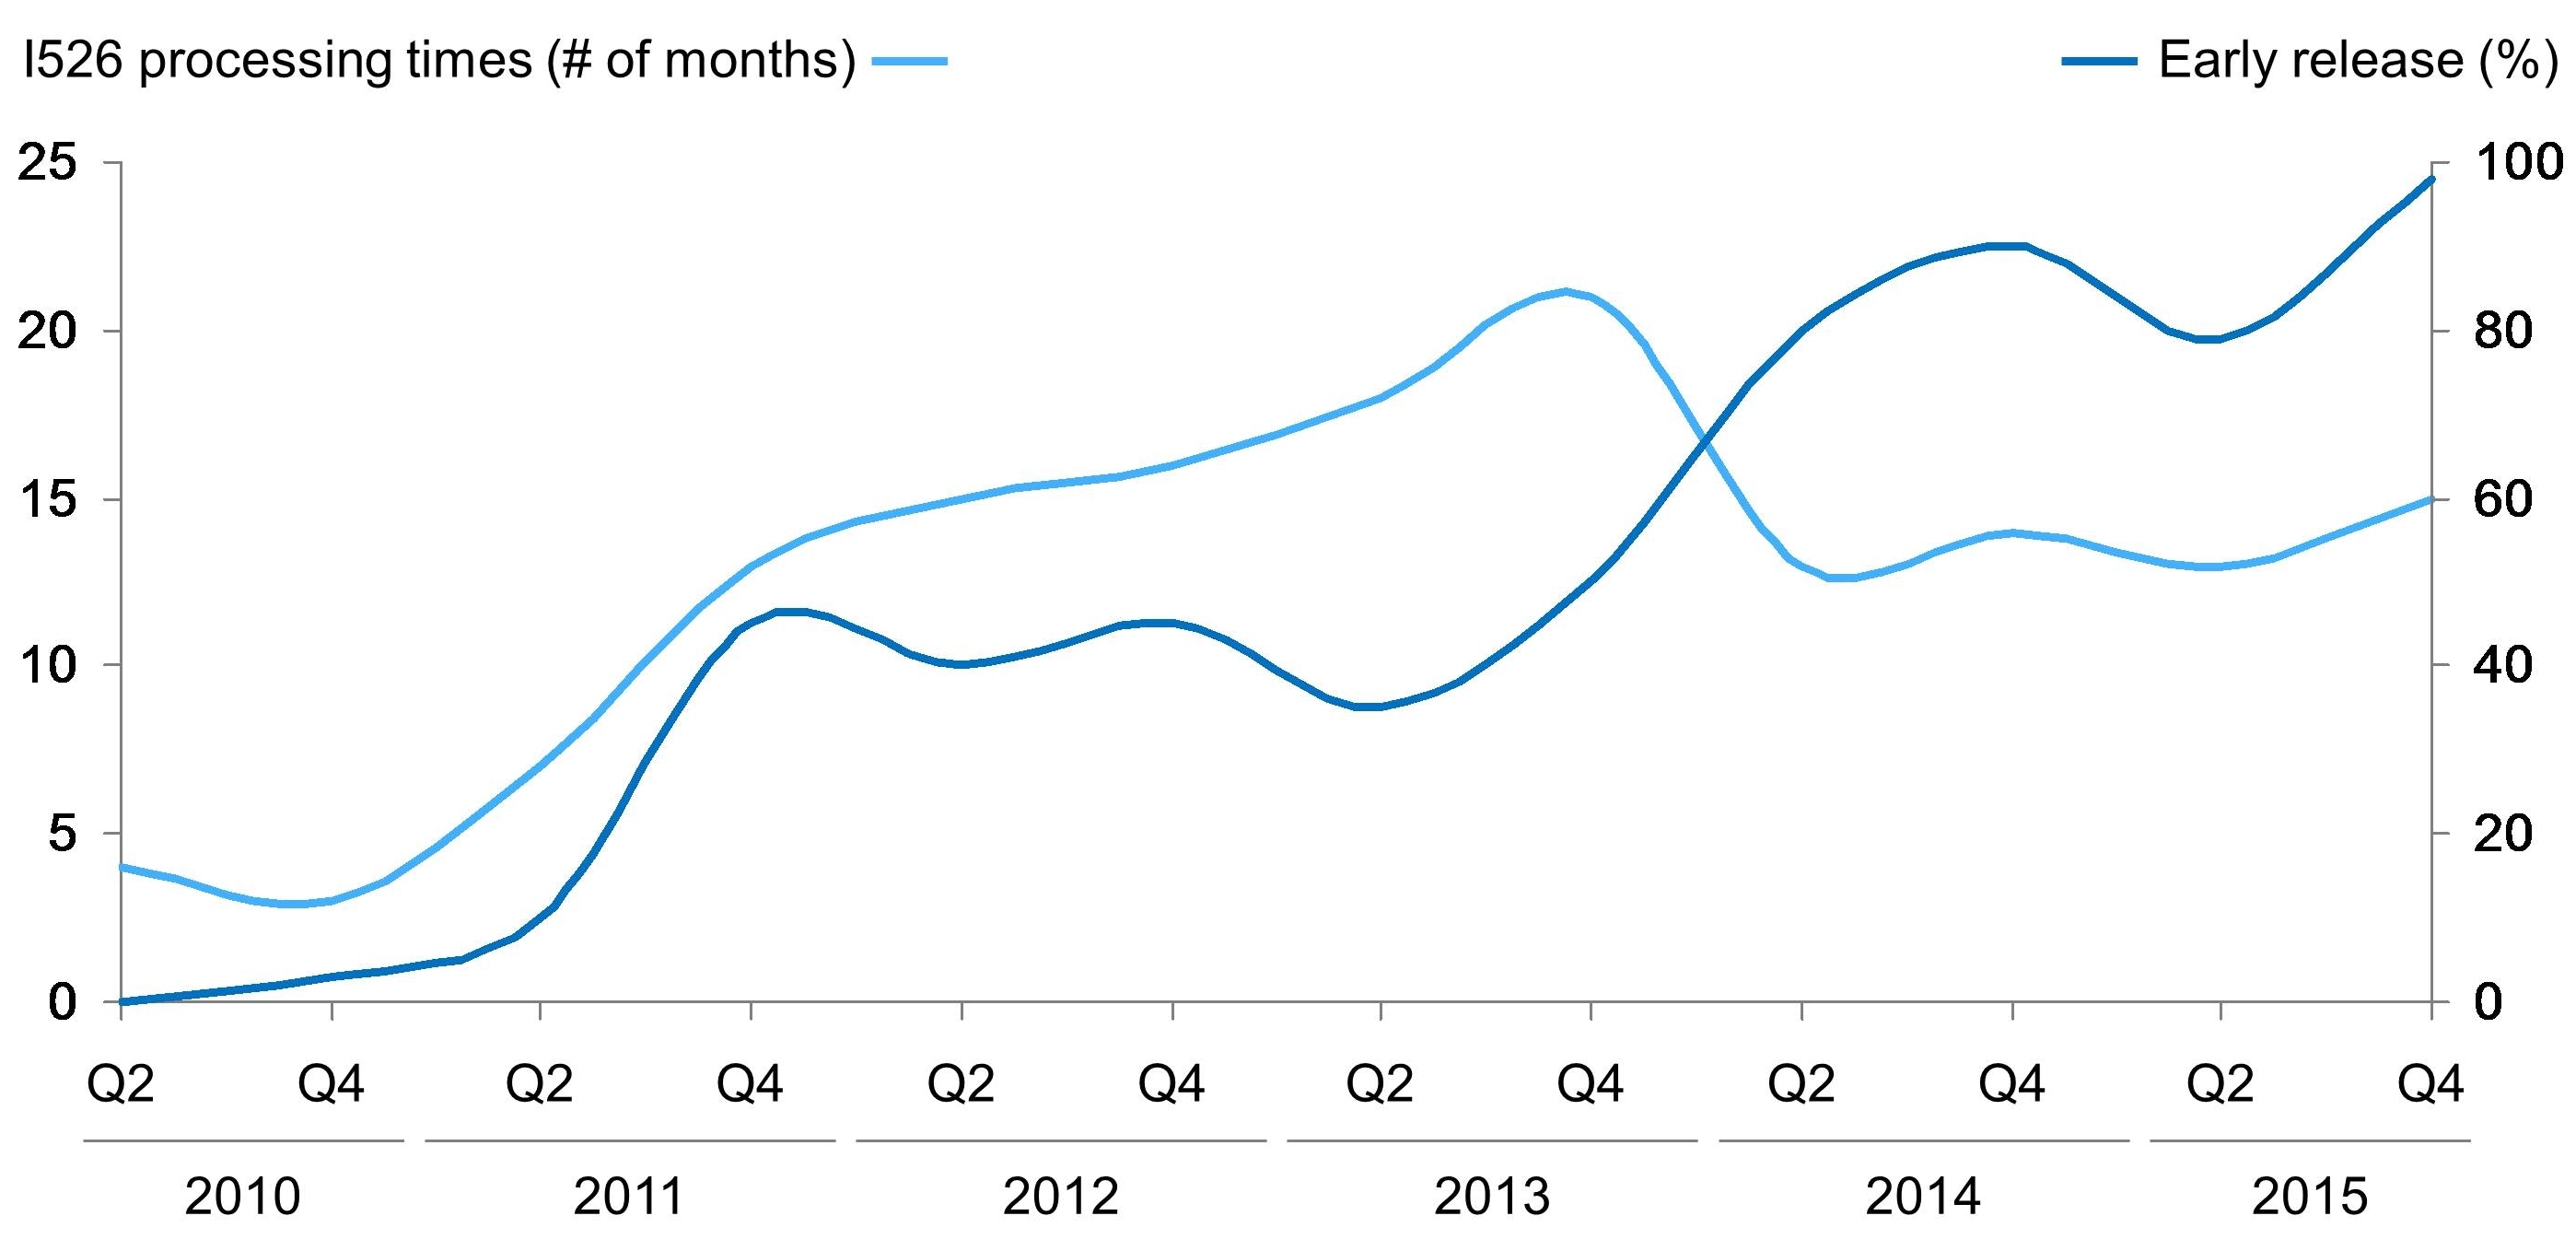
Projects are getting funded earlier and earlier, with terms allowing for early release escrow becoming the standard in project agreements. In the fourth quarter of 2015, most projects allowed some form of early release escrow. This trend corresponds with decreasing processing times for I-526 forms.
EB-5 Funding Analysis
Latency Between Contract Signing and Investor Funding
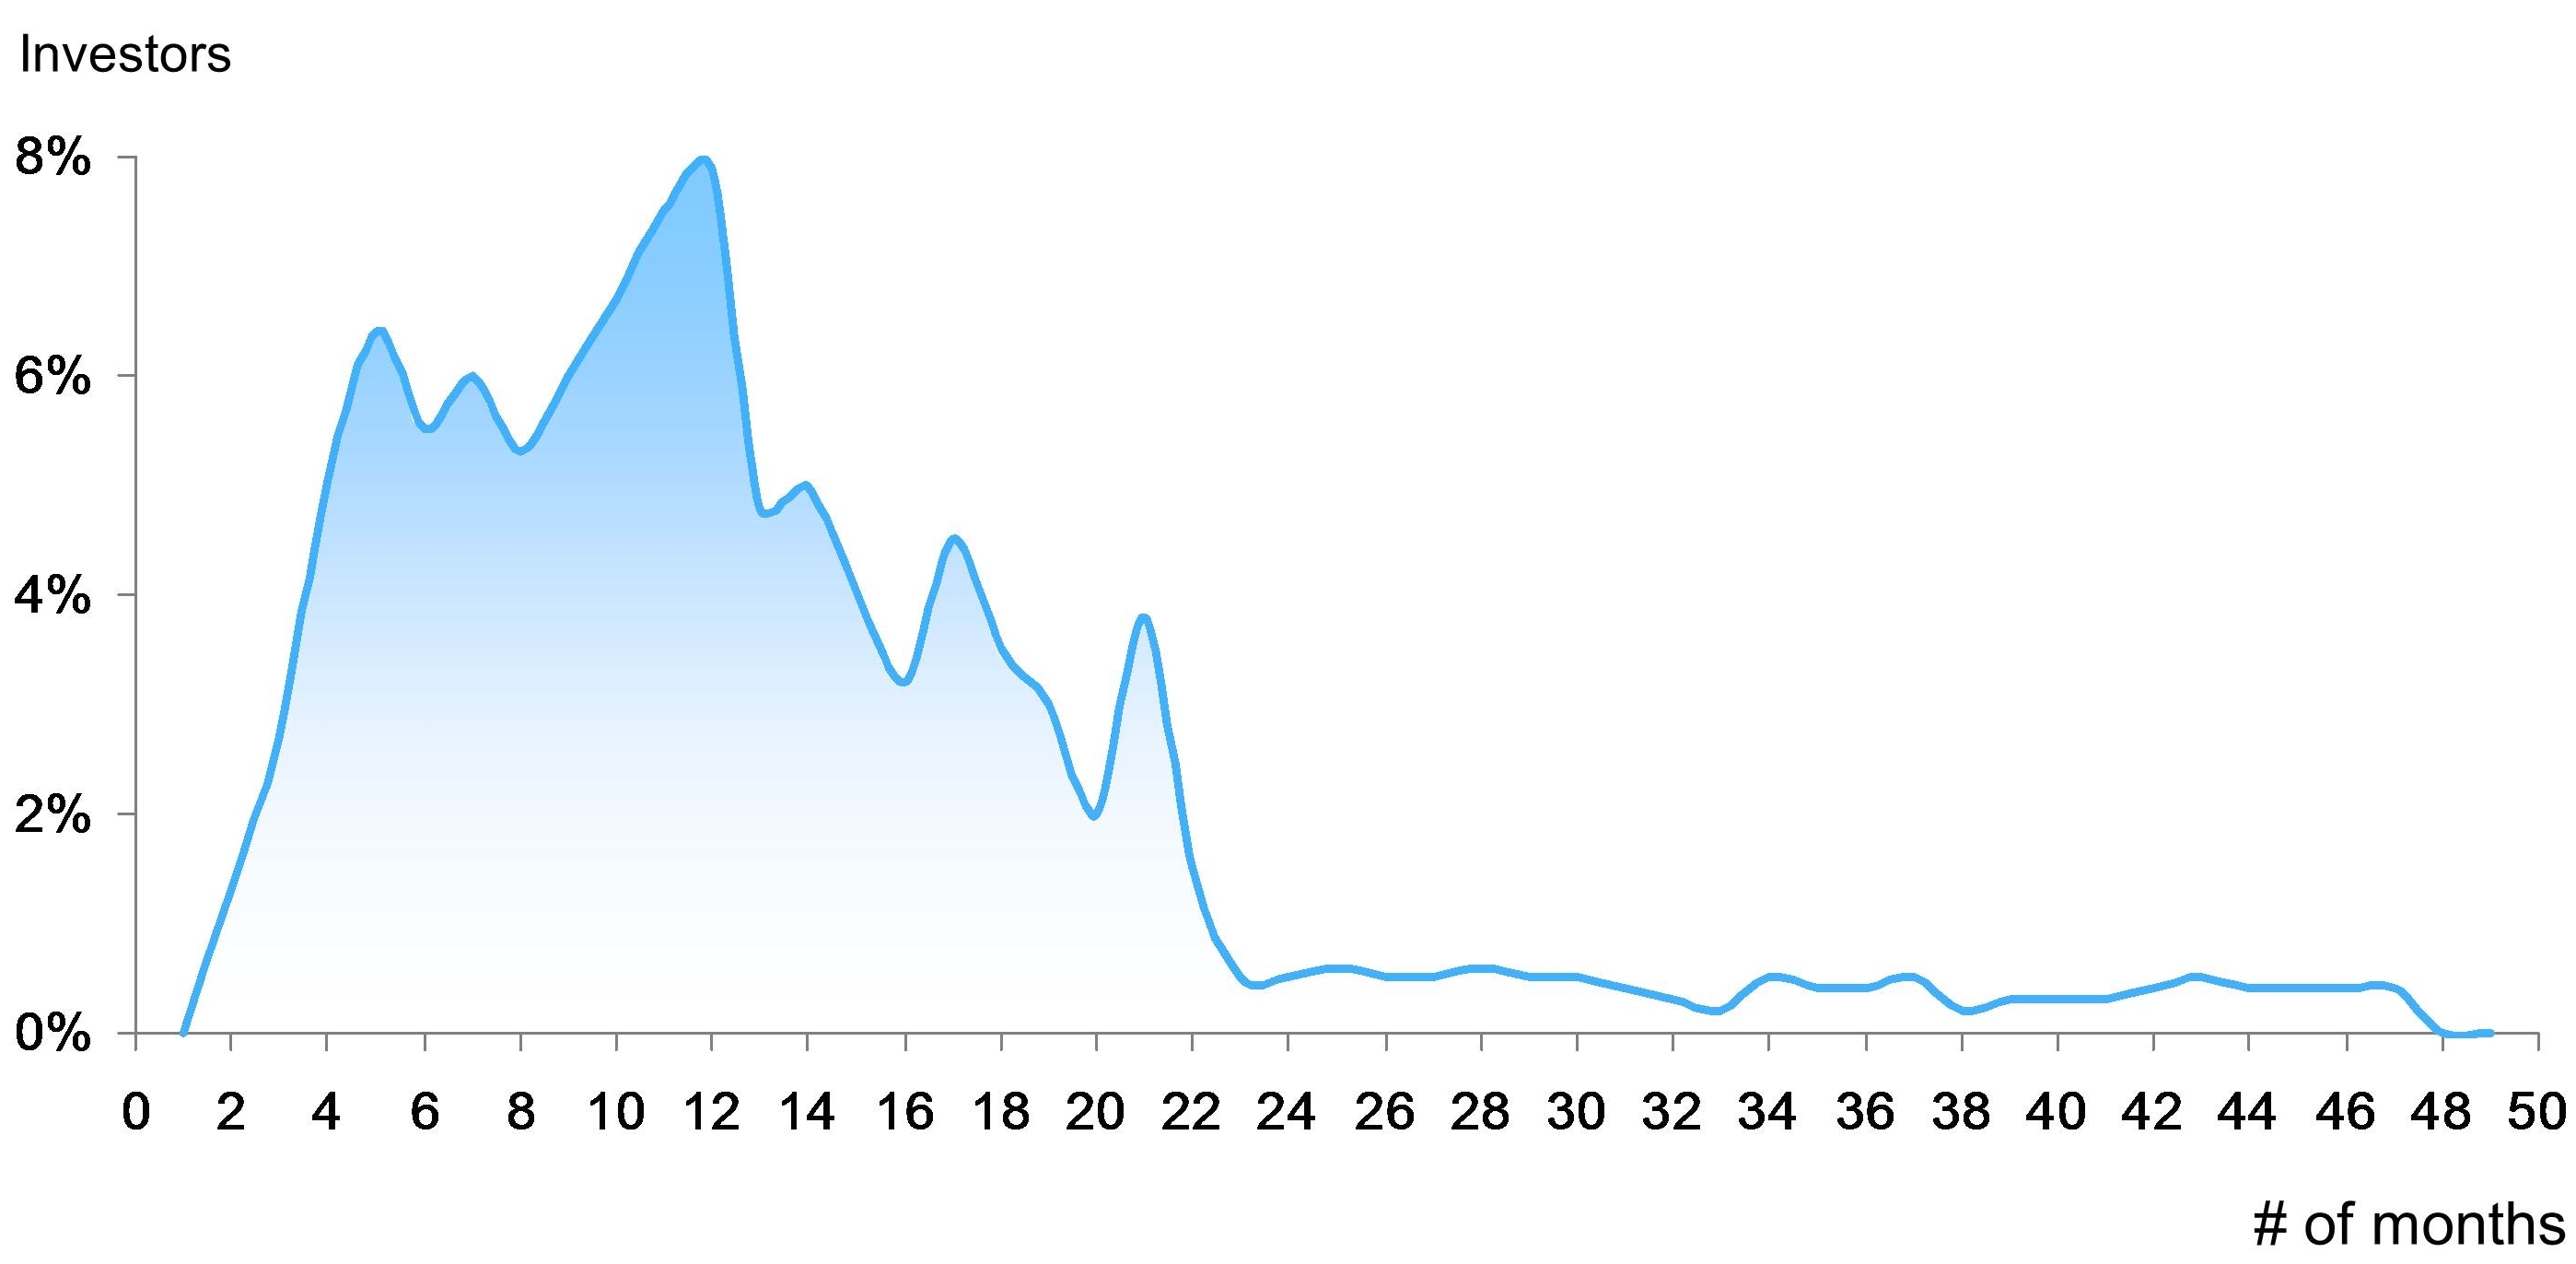
One of the most common questions project developers ask is, After all the documentation, how long will it be before I receive funding for my project?
A little over 1 year after contract signing is typically how long it takes to receive investor funding. Very few projects are funded within a few months after contract signing. Most projects receive investor funding after between 4 and 20 months. Fundraising is a long and difficult process, and in particular, attracting the first few investors can be very difficult.
EB-5 Funding Analysis
Cumm Investors Funded vs. Time Since Contract Signed
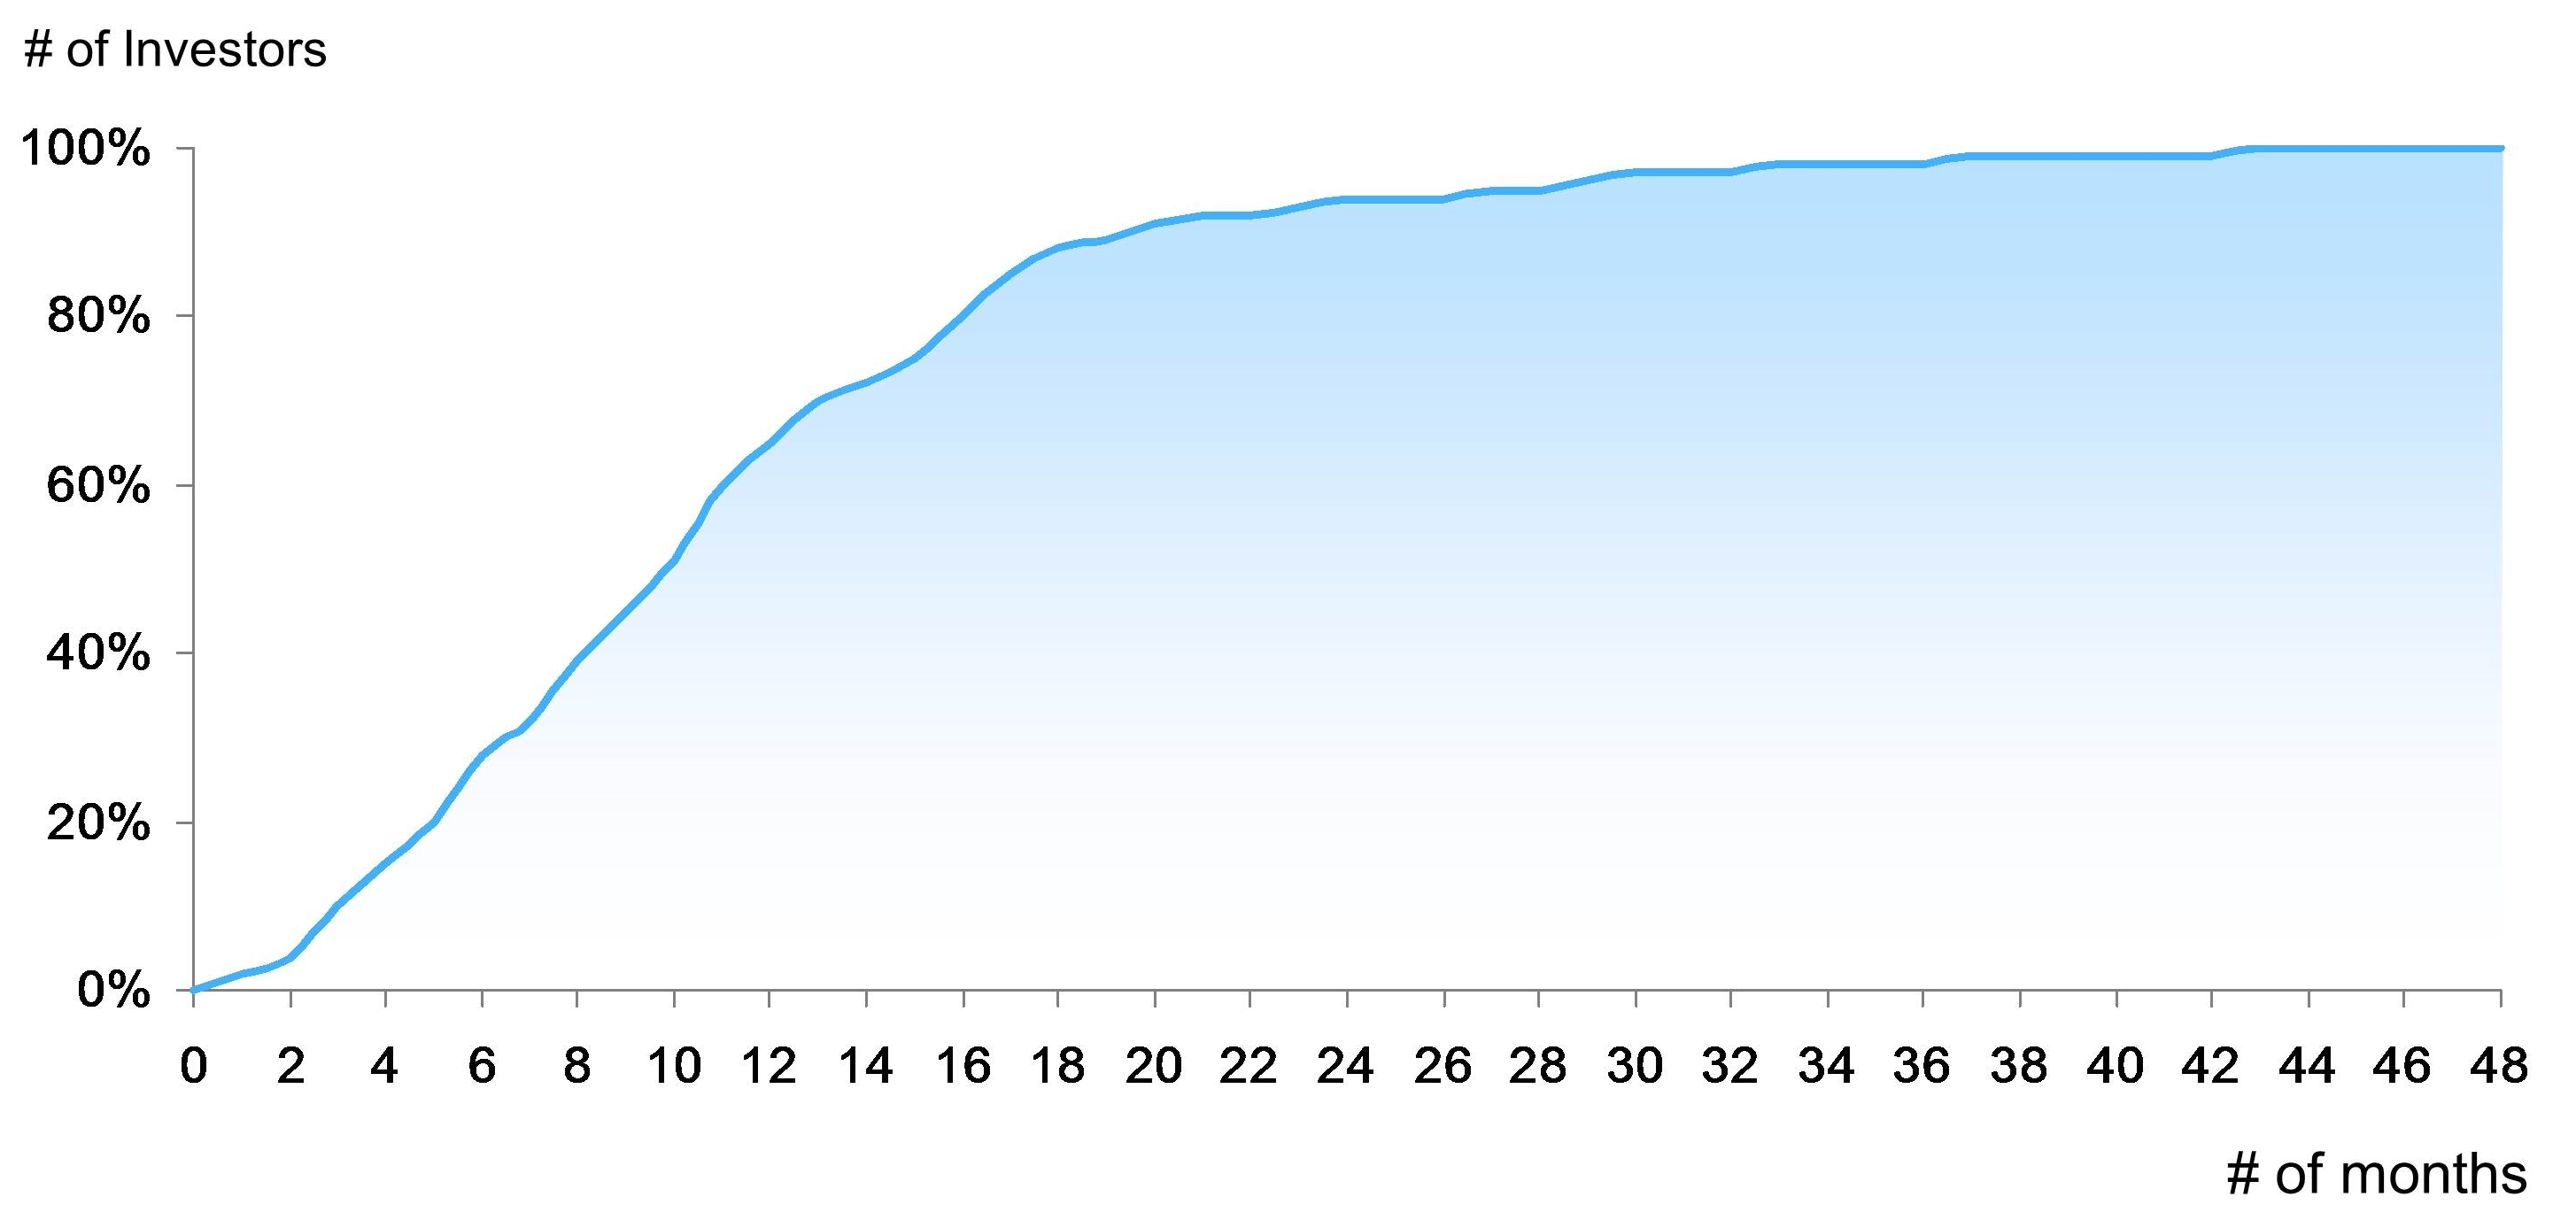
Fundraising is a lengthy and expensive process. Even after a year from the time contracts are signed and documentation is submitted, most projects raise only 60% of the funds needed. It takes roughly 2 years for a project to achieve 90% of its fundraising goal. Successful developers expect these fundraising challenges for projects and arrange their funding structures accordingly.