Every year, the U.S. Department of State releases the Report of the Visa Office, which offers a peek into the statistics of the U.S. visas, including EB-5 visas, issued throughout the given year. In the report, EB-5 visa statistics are spread out across two different tables: Table V Part 3 (visa recipients who already resided in the US under a different visa) and Table VI Part IV (visa recipients who were granted their visa while abroad). The recently released Report of the Visa Office 2019 offers insights into which countries the EB-5 investors who were granted U.S. permanent residency in FY2019 are from.
One important thing to note is that these statistics do not reveal the current EB-5 demand. Because of the long I-526 processing times, investors receive their green cards only after a few years—and often more for investors from China, India, and Vietnam, who must wait in large backlogs for their opportunity to apply—so the information in these charts is more reflective of the EB-5 demand from a few years ago. Unfortunately, United States Citizenship and Immigration Services (USCIS) does not release any information about the number of I-526 petitions it receives each year, so the most up-to-date information we can access on EB-5 demand is the EB-5 visa statistics. It is also possible to make predictions based on the EB-5 program processing statistics from the past 11 years, however.
The EB-5 Visa Cap
As suggested by the addition of the number in its name, the EB-5 program is not the only EB visa program. USCIS sets a limit on the number of EB visas that can be issued per year, and only 7.1% of those visas are allocated to the EB-5 program. Further dividing up the EB-5 visas—of which there were 10,076 in FY2019—no single country is permitted to account for more than 7% of the yearly EB-5 visa allocation (in this case, 705). Since this restriction does not account for a country’s population or EB-5 demand, it naturally affects some countries—such as China or India—more than others. If, at the end of the fiscal year, there are still EB-5 visas left, USCIS will issue them to countries with backlogs, slightly exceeding the country visa limit. This occurred in FY2019, with India and Vietnam both receiving slightly more visas than the country limit of 705.
EB-5 Visas Granted Domestically vs. Internationally
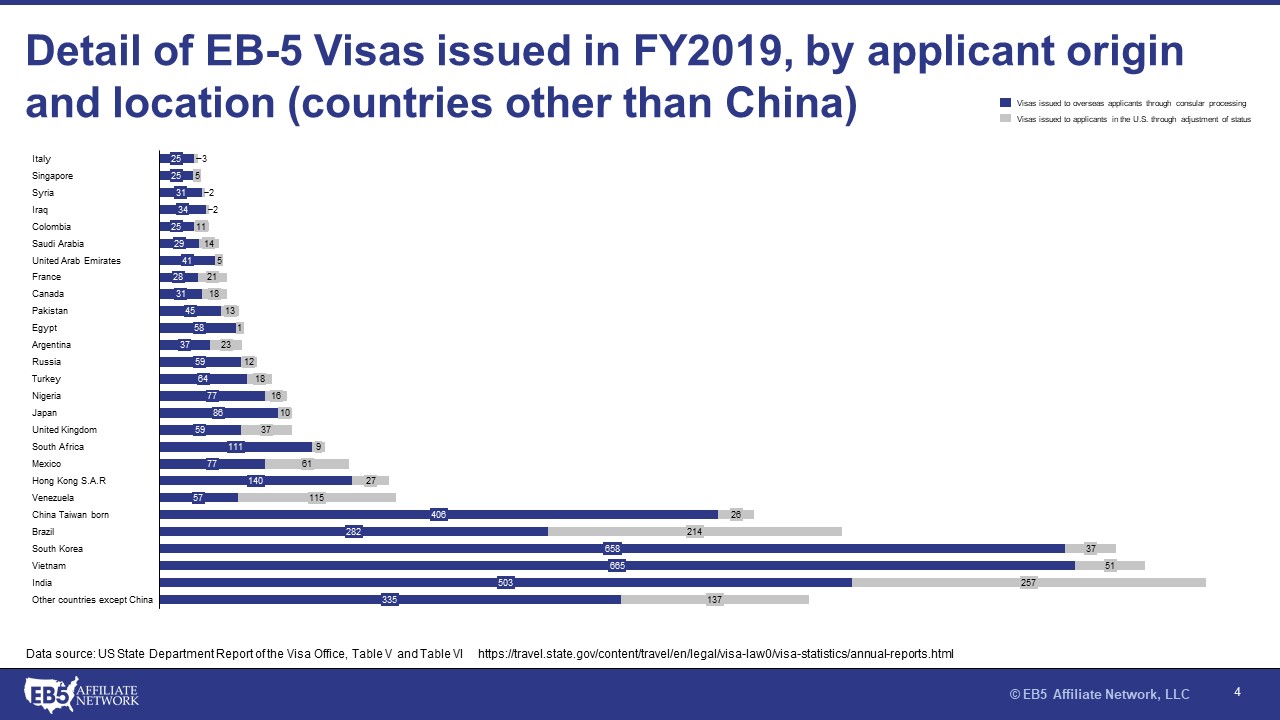
As of 2017, the total migrant population of the United States was nearly 50,000,000—more than the population of many countries. Not all of these immigrants are permanent residents, however, so many EB-5 investors make their investments from within the United States. This way, they can switch their current visa to an EB-5 visa without having to leave the United States. The Report of the Visa Office 2019 reveals that close to one half of all South American EB-5 investors were already living in the United States when they received their green card. European and Indian EB-5 investors were more likely to apply from their home country, with one-third applying for adjustment of status within the United States. Regarding Chinese EB-5 investors, only 10% were already living in the United States when they received their EB-5 visa, but given the huge number of Chinese EB-5 investors, that still accounts for 433 people. Similarly, most Africans who received EB-5 visas in FY2019 did so in their home state, but the total number of African nationals who were granted EB-5 visas was lower than the 10% of Chinese applicants already living in the United States.
Investor Visas vs. Family Member Visas
Despite the EB-5 visa program’s original intentions, the majority of the yearly 10,000 or so available EB-5 visas are not granted to investors. A large portion of investors apply with their spouse and children, especially since the EB-5 program offers benefits such as facilitated access to U.S. colleges and universities, so family members regularly account for a larger share of the available visas. According to the DHS Yearbook of Immigration Statistics, investors only account for around one-third of the EB-5 visas granted—42% go to children and 23% to spouses. This means that in FY2018, instead of the 10,000 investments and at least 100,000 new jobs one might expect, there were 3,363 investments and at least 33,630 new jobs.
EB-5 Visas Broken Down by Country
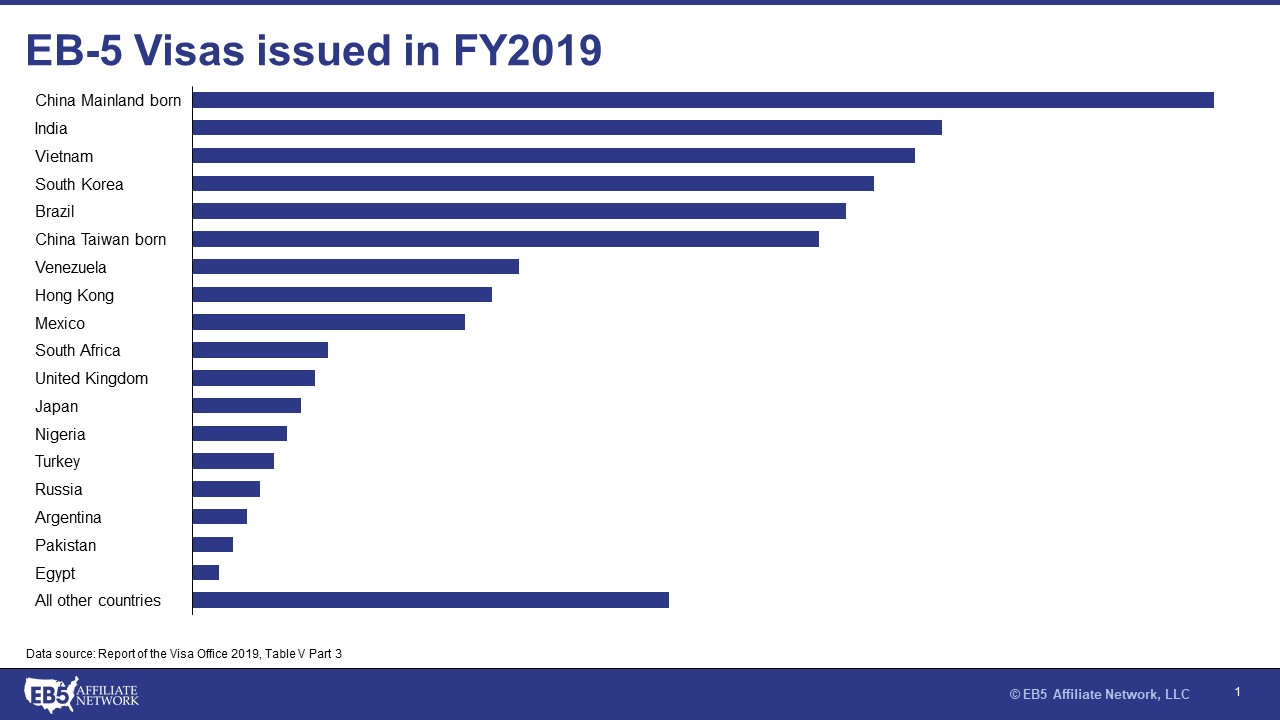
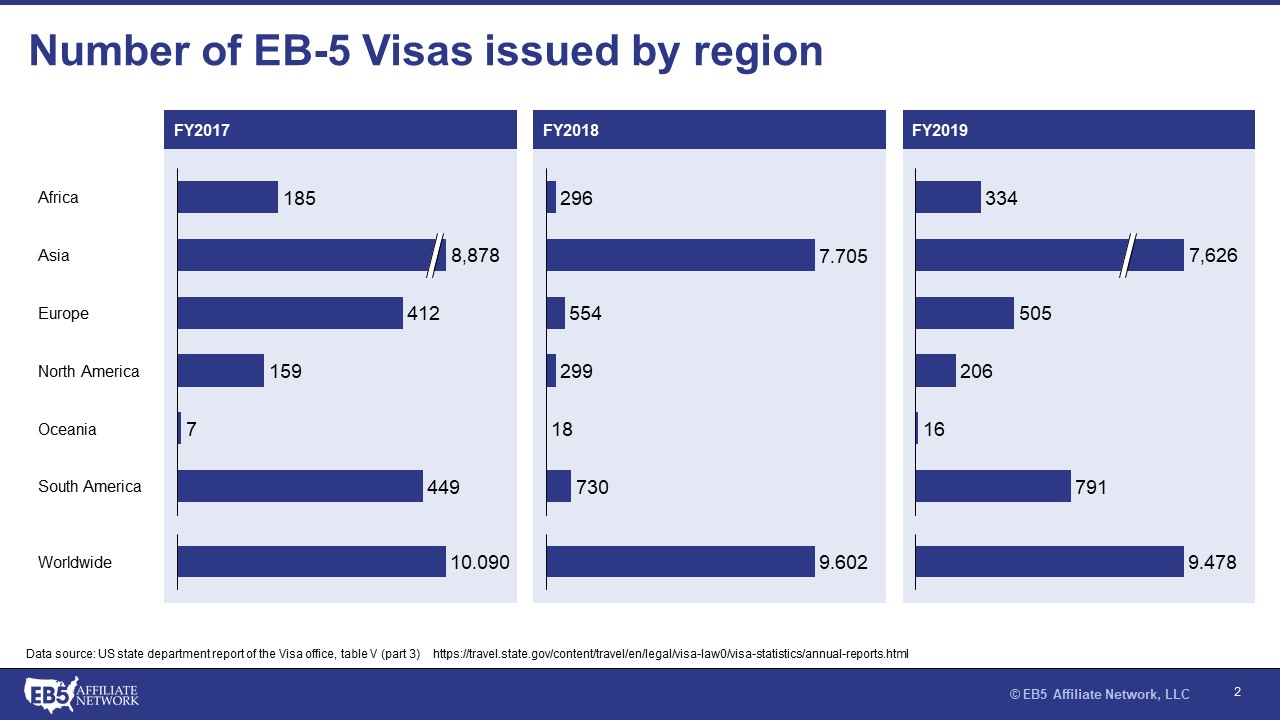
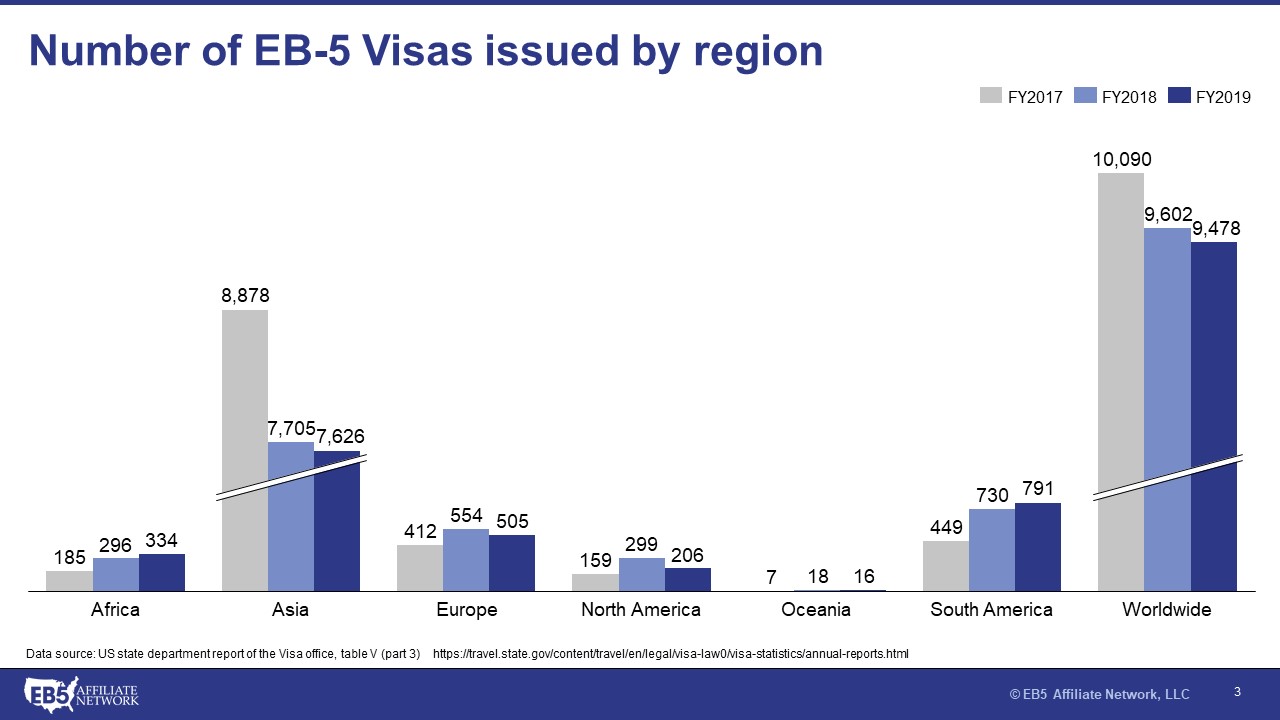
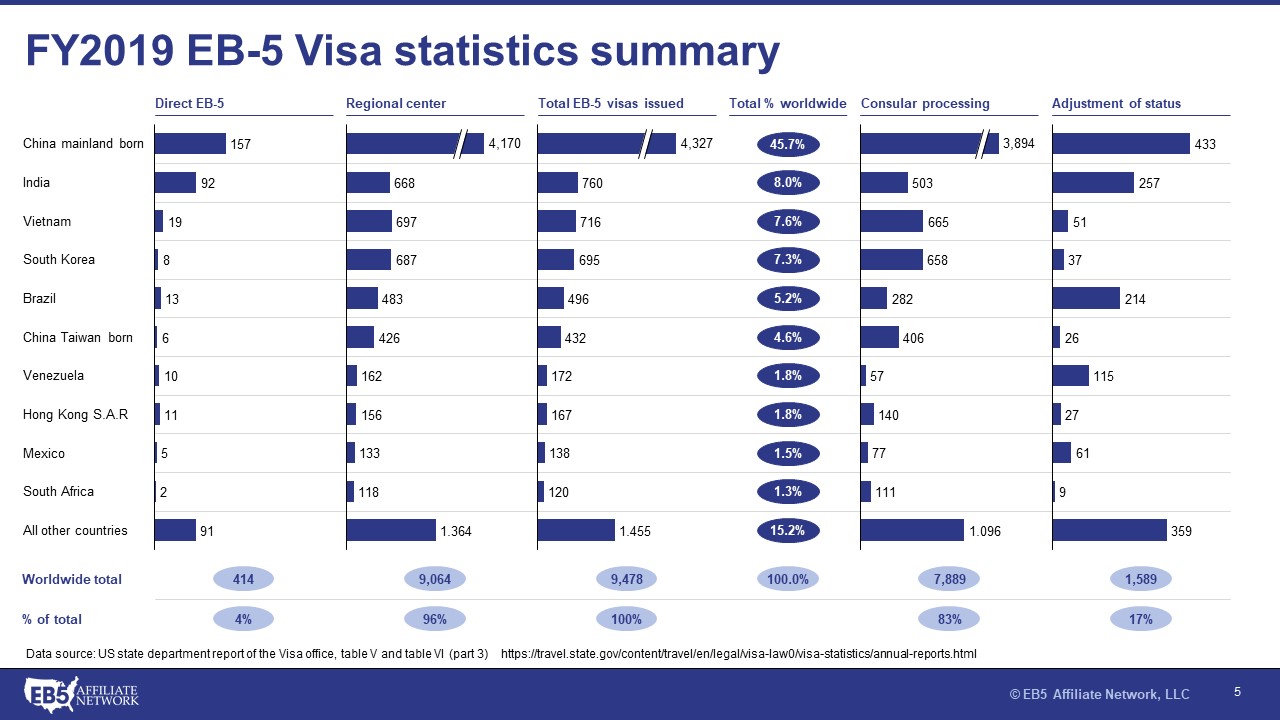
The EB-5 visa statistics for FY2019 show that China still maintains its lead by a large margin, but other countries are slowly beginning to catch up, and more and more countries are jumping into the program. India, Vietnam, South Korea, Brazil, and Taiwan are the next in line after Mainland China, with India and Vietnam exceeding the country limit and South Korea dangerously close. The future could see more countries reaching their country limits, not only as a result of the increasing popularity of the EB-5 program but also because of the new visa-availability processing approach that USCIS is adopting from April 2020 onward. Instead of the current first-in-first-out approach, USCIS will begin prioritizing I-526 petitions based on the visa availability of the applicant’s country, which is good news for Brazilian, Taiwanese, Venezuelan, and other EB-5 investors but bad news for Chinese, Indian, Vietnamese, and South Korean investors.
It is interesting to note some of the countries that appeared on the list, such as North Korea. Exactly how four wealthy North Koreans managed to contact EB-5 projects from within their isolated nation with a 30-website-strong intranet is the most fascinating mystery the FY2019 EB-5 country statistics provide.
When the country statistics are broken down further, they reveal that the majority of investors worldwide made EB-5 investments via regional centers instead of working directly with the EB-5 project developer. In several countries, including Nigeria, Japan, Argentina, Turkey, and Egypt, 100% of investors invested through a regional center, even though between 59 and 96 investors from each country received EB-5 visas in FY2019. There are numerous advantages of regional center investment, such as relaxed job creation requirements that allow project developers to include indirect and induced jobs in the calculation, which likely accounts for the clear preference for regional center investment.
Don’t Forget to Work with the NVC
EB-5 investors do not automatically receive conditional permanent resident status in the United States upon the approval of their I-526 petition. Instead, they gain the right to apply for a visa, and they must become documentarily qualified before they are eligible to do so. EB-5 investors living abroad should work with the National Visa Center (NVC) to complete the required forms and file the necessary documentation. The next step for EB-5 investors applying for a visa through a U.S. consulate is to undergo an immigration interview. Many Chinese investors experience additional delays in their EB-5 process because they are ineligible for immigration interviews once their priority date finally becomes current. To ensure a smooth EB-5 journey that is as fast as possible, all factors considered, it is necessary to work with the NVC in a timely manner.


