
If Your Project Qualifies as a TEA, The Next Step is to Order a Report
Our TEA Report provides USCIS with a detailed, easy to follow analysis of the census tract assembly methodology and calculation needed to meet the USCIS unemployment EB-5 TEA requirements.
Video Transcription of TEA Map Help Video for Census Tract Combination
Hello. My name is Jeremy Shackle and I am a Senior Associate with EB5 Affiliate Network. In this short help video, you will learn how to utilize EB5AN’s free national TEA map to determine if the location of a project or business can be designated a targeted employment area.
The current USCIS rules for TEA formation, which have been in effect since November 21, 2019, allow high unemployment TEA designations using one of two methods: census share or ACS. Additionally, locations outside of metropolitan areas may qualify as rural, which does not consider the local unemployment rate. Because the census share and ACS methods use employment data covering different time periods, a location might qualify using one method but not the other. Therefore, you should always check using both methods to see if your location qualifies.
Our map lets you check TEA eligibility using all three methods: ACS, census share, and rural. The default is census share, but you can easily change the method to ACS, or you can check to see if the site qualifies as a rural TEA. Let’s check a specific location to see if it qualifies. In the address box, we’ll enter 601 Biscayne Boulevard in Miami, Florida. This is the American Airlines Arena. We’ll zoom out for a broader view.
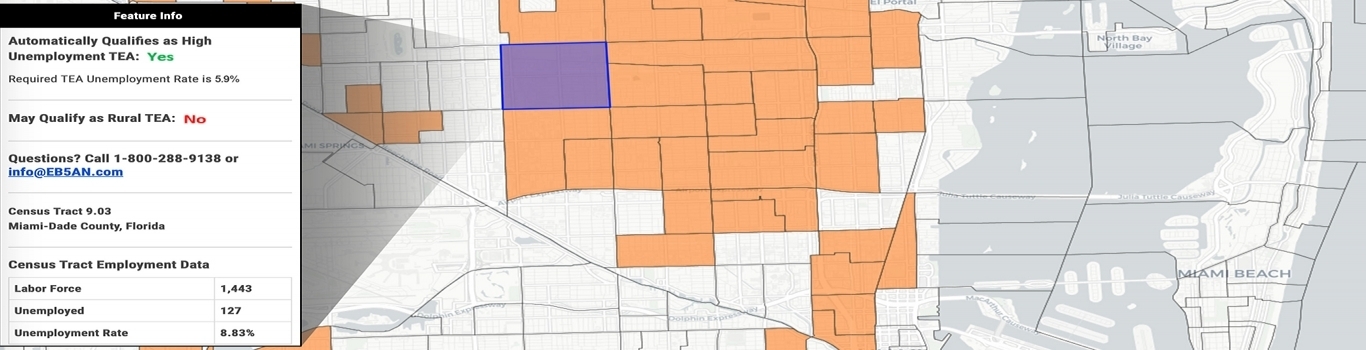
The right pane of the screen has valuable information and instructions that you should read before using this map, but I’m going to hide this pane for now to allow a larger viewing area. The orange shaded areas are census tracts that automatically qualify as high unemployment TEAs. We can see in the left pane of the screen that our location is in Miami Dade County, census tract 37.02, which does not automatically qualify. This tract has an unemployment rate of 3.08%. The minimum unemployment rate to qualify using 2018 data is 5.9%, which is 150% of the national average for that year.
Our next step is to check for automatic qualification using the ACS method. This is the US Census Bureau’s American Community Survey five-year data. When we change the method by un-checking the census share box and checking the ACS box, we can see that more tracts are shaded orange. But tract 37.02 is not one of them. Let’s click on the tract to refresh the findings in the left pane. We can see that the ACS unemployment rate is 3.17%, and the qualifying rate is 8.9%, so we’re actually farther from automatic qualification using this method. The reason why the qualifying rate is higher for ACS than for census share, is that the ACS method calculates an average unemployment rate for the last five years, and nationally, unemployment has been declining year on year for a decade now. Sometimes that helps a location to qualify as a TEA but not in this instance.
Our next step is to try combining tracts to get a weighted unemployment rate that is greater than the minimum. In the lower right corner of the screen, click the icon with three hexagons. This will open the query tool. The default query method is ACS, so we’ll start with that. We’ll check the census share method later. To the far right of the word location, click on the icon of a hand with an extended index finger. Next, click on the encompassing census tract.
The tract will be shaded blue to show that it is added to the query. Now we want to click on each of the orange tracts that abut the encompassing census tract. There are three. One, two, and three. Under current USCIS rules, a census tract may be comprised of only the encompassing tract, and adjacent tracts. If a tract does not share a border with the encompassing tract, it should not be included in the query. It would not help to include tracts that are not orange, because their comparatively low unemployment rates would cause the weighted average to be lower. To see the weighted average unemployment rate for the combined tracts, we will click the get results button in the lower right corner, and then we’ll click on generate report.
It says, “4 Results.” That’s because there are four tracts in the query. The data is aggregated and we can see that the unemployment rate is 9.96%, which is higher than the 8.9% minimum, so that’s good. We could stop here. But before we close the map, let’s check the result using the census share method. If the location had not qualified using ACS, this would be our next step. Click the back arrow twice and then click the reset button. This will clear the selection of census tracts.
Next, click on the map legend icon. Here we will change the method from ACS to census share. The map changes to show the unemployment tracts shaded in orange. Once again, we will click the button for the query tool, and we need to change the method to census share for the query. This does not automatically change when you change the method for the map view.
We’ll click the icon for the selection tool. Mouse over to track 37.02 on the map. Let’s zoom out really quick. This is the encompassing tract, so we will select it, followed by the three orange, abutting tracts. One, two, and three. The four tracts are shaded blue, so we’ll click get results. Then we’re going to click generate report as before. The weighted unemployment rate is 7.57%, which is higher than the 5.9% minimum for the census share method using 2018 data.
This location qualifies as a TEA using both the ACS and census share methods, if we combine adjacent tracts. But notice that the combination of tracts is slightly different for the two methods.
The next step is to order a TEA report from EB5 Affiliate Network. We’re going to expand the right pane, and click here.
Thank you for watching. If you have any questions, send me a message at the email address in the left pane.