

Likely due to the Freedom of Information Act, United States Citizenship and Immigration Services (USCIS) has released quarterly processing information for I-526 and I-829 petitions in FY2019 Q1. The data contained in the I-526 and I-829 processing data for FY2019 Q1 provide answers to certain EB-5 questions for which there is generally no concrete information, including whether approval rates vary by country, whether petition processing times vary by country, and which countries are filing the most I-526 petitions.
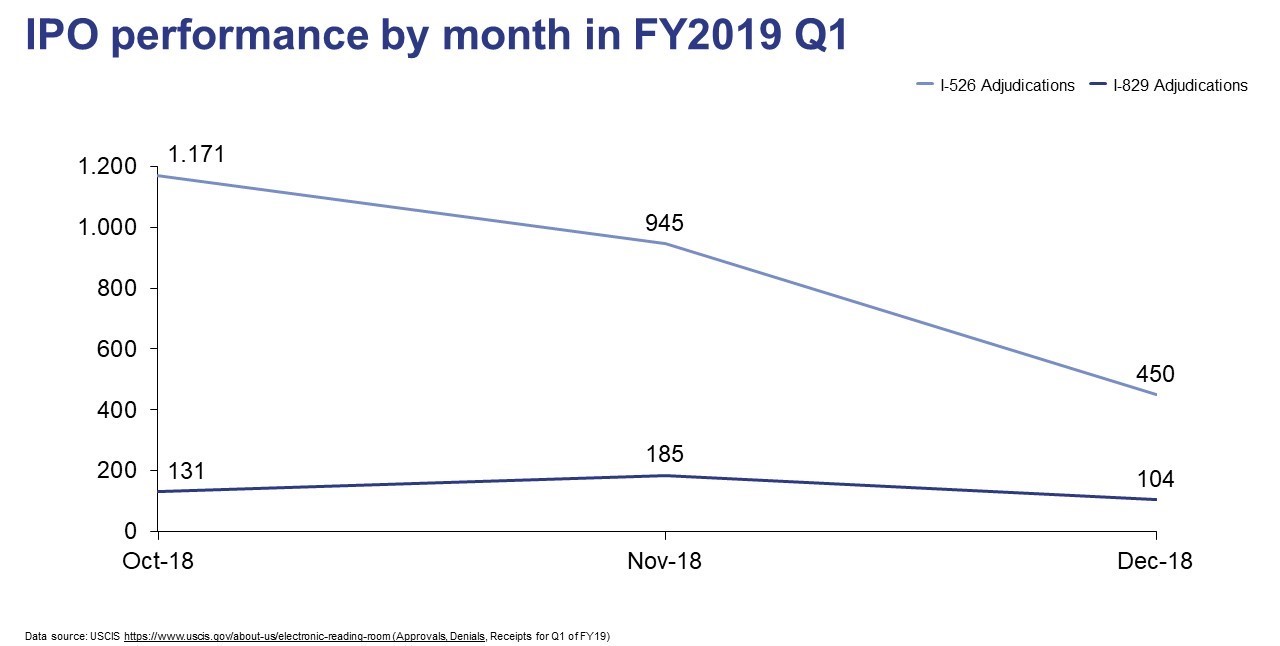
USCIS underwent an important change in FY2019 Q1: the introduction of a new IPO chief, Sarah Kendall. Kendall took over for Julia Harrison, after which processing volumes fell dramatically. Kendall’s leadership has led to a stricter EB-5 process, with denial volumes remaining steady but approval volumes sinking.
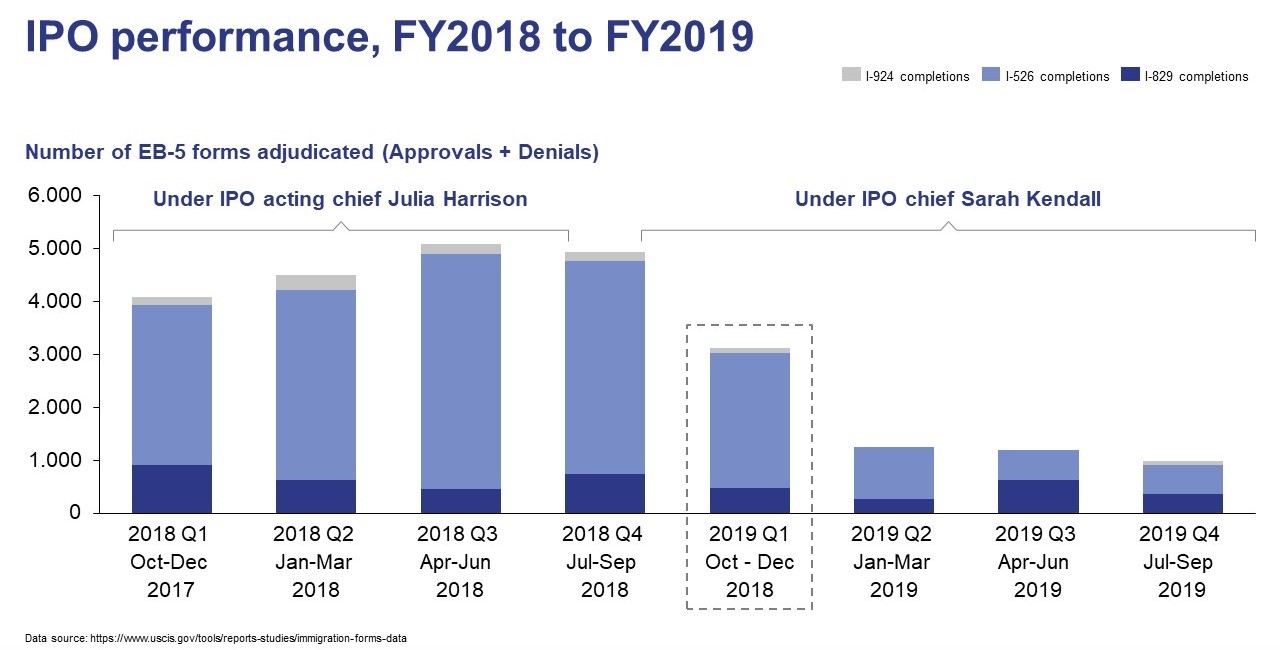
FY2019 Q1 finds itself right in between FY2018’s high processing volumes and the remainder of FY2019’s low processing volumes, so it may not entirely represent the EB-5 circumstances before and after. Nonetheless, the data provide interesting insights.
Processing Times
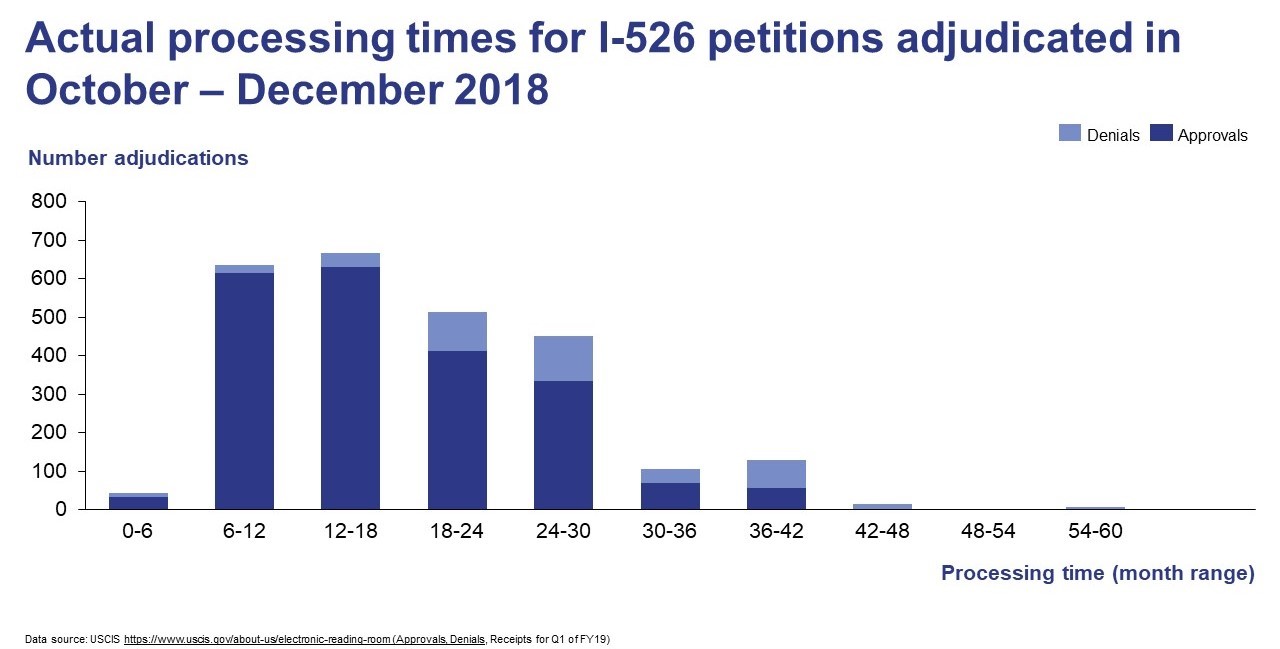
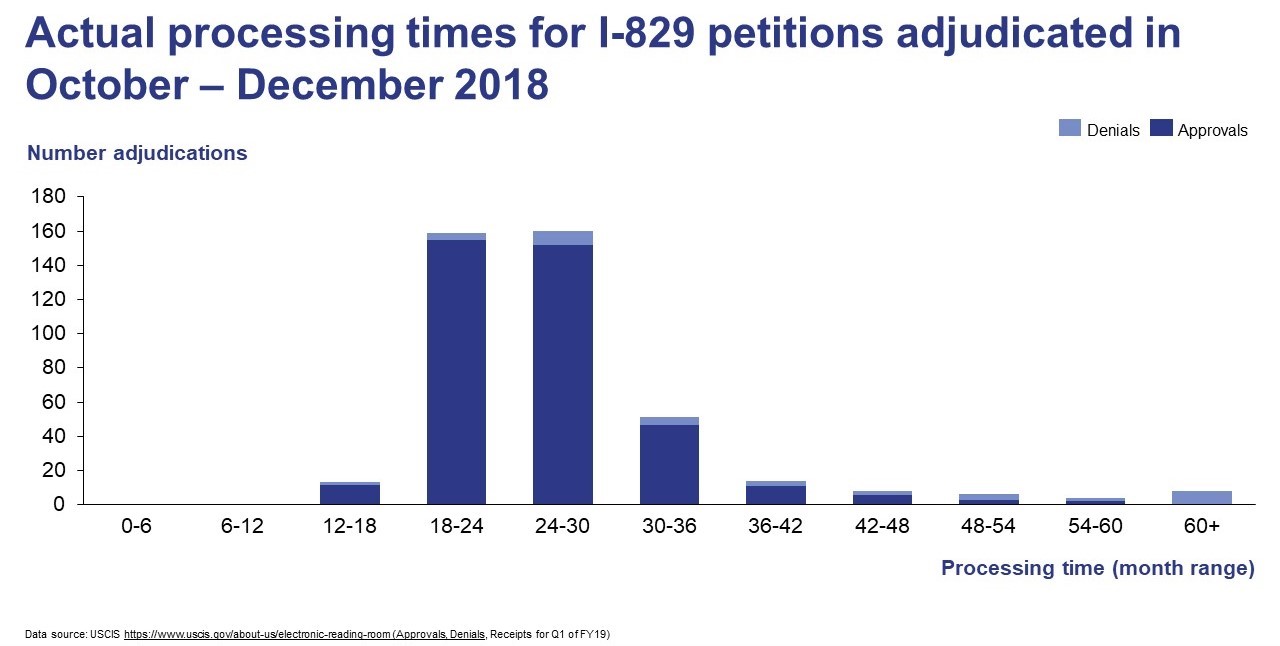
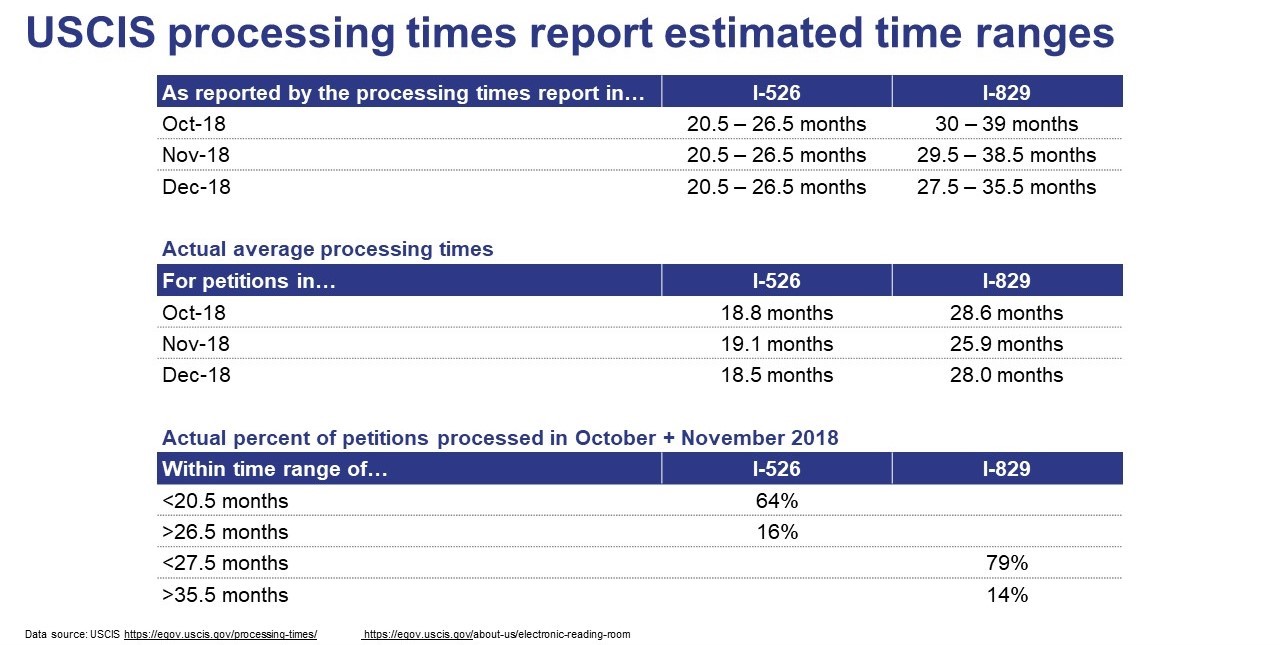
Throughout the quarter, USCIS estimated that I-526 petitions would take 20–26 months to process and I-829 petitions 27–39 months. According to USCIS, the first number in the range is the median time it takes to adjudicate the respective petitions, while the second number is the period in which 93% of petitions have been adjudicated.
The range given did not entirely reflect the actual processing times during FY2019 Q1. In terms of I-526 petitions, 64% were adjudicated before the lower number in the range, while 16% took longer than the higher number. In total, that means 80% of I-526 adjudications fell outside of the estimated processing range.
The estimated processing period was even less accurate for I-829 petitions. A whopping 79% were adjudicated in only 27.5 months or less, and 14% extended beyond the outer range of the estimated period. That means that at most 7% of I-829 petitions were adjudicated within the estimated processing period, as opposed to the 43% that would be expected.
In general, petitions were processed a bit faster than estimated. Approvals were processed faster than denials, with the average I-526 approval taking 17.5 months and the average I-829 approval taking 26 months.
Country Differences
The data on I-526 adjudications for FY2019 Q1 reveal some differences in processing time by country, but it does not suggest that USCIS was already using a visa availability approach during this quarter. I-526 petitions from Chinese EB-5 investors took, on average, two months longer to be adjudicated than petitions from investors of other nationalities.
On the opposite end of the scale, Indian EB-5 investors had their I-526 petitions processed particularly quickly, with an average processing time five months shorter than the global average. This was to be expected, however, as Indian EB-5 investors have filed a large number of expedite requests. Indians accounted for 83% of the I-526 petitions adjudicated within six months during FY2019 Q1.
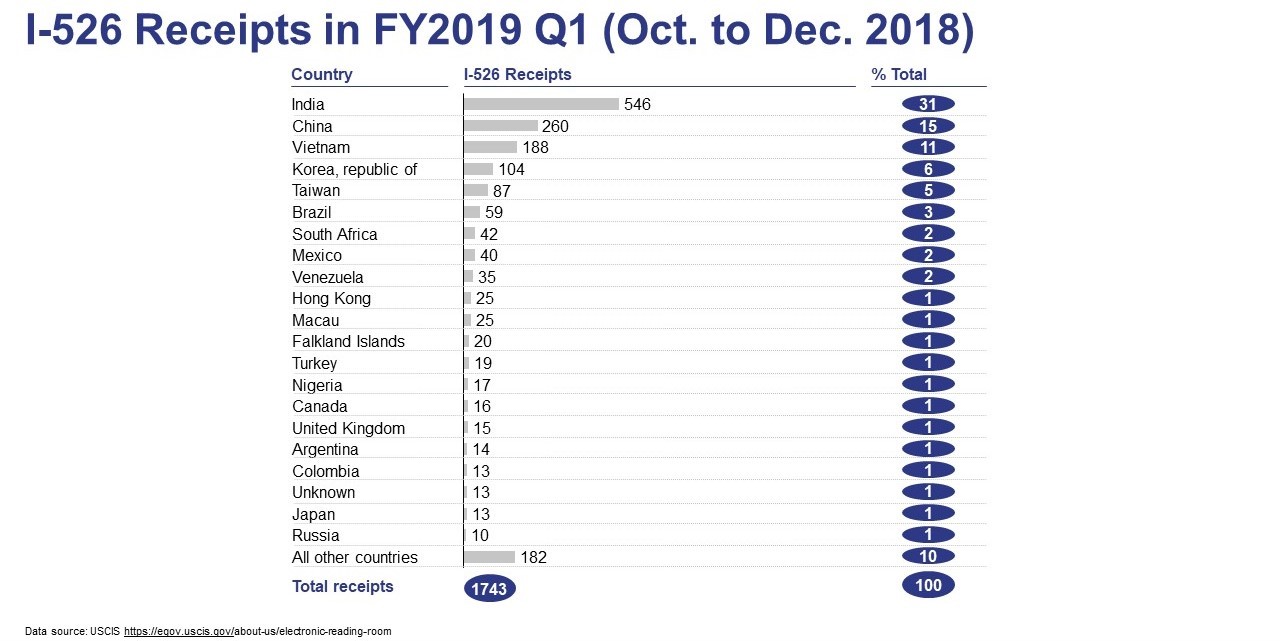
Of the I-526 petitions filed in FY2019 Q1, the largest country demographic group was Indians, at 31%. Long-time champion China followed at 15%, with Vietnam in third place at 11% and South Korea in fourth with 6%. In FY2019 Q1, Indian EB-5 investors filed enough I-526 petitions to account for more than a year and a half’s worth of Indian EB-5 visas.
In terms of I-829 petitions filed, Chinese EB-5 investors dominated, accounting for 81% of all receipts and adjudications. Since I-829 figures generally reflect the I-526 numbers of previous years, these data are unsurprising.
Additional Facts about I-526 and I-829 Processing
- I-526 denials are categorized into two types: “fraud” and “others.” In FY2019 Q1, only a single I-526 petition was denied based on fraud.
- The “country” column for I-526 petitions begs numerous questions. An astounding 20 I-526 petitions are recorded as having come from the Falkland Islands, which the Department of State recognizes as belonging to the United Kingdom. Furthermore, with a population of just around 2,000, it is extremely unlikely that 20 Falkland Islanders have filed I-526 petitions at any time during the EB-5 program’s history, let alone in a single quarter. An additional 13 petitions are classified as having come from an “unknown” country, 8 from the USSR, and, bafflingly, one from the United States.
- There is a discrepancy between the 1,808 I-526 petitions processed in the official quarterly report and the 1,743 processed in this detailed quarterly report.
- The data make clear that USCIS has not been operating under a strict first-in-first-out (FIFO) basis. Under a true FIFO system, the estimated processing range would not be so wide, and the data indeed reveal that Chinese investors are subjected to slightly longer waits than EB-5 investors from other countries. It is also clear that denial decisions take longer to make than approval decisions.